Download

1 / 20
200 likes | 221 Vues
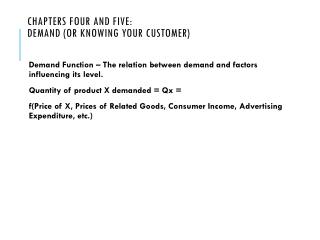
Chapters 4: Individual and Market Demand. Price-Consumption Curve. margarine. Price-Consumption curve. P=$7. P=$3. P=$2. 10. 20. 32. butter. Price. 7. 3. Demand for butter. 2. 10. 20. 32. Quantity of butter.

E N D
Price-Consumption Curve margarine Price-Consumption curve P=$7 P=$3 P=$2 10 20 32 butter Price 7 3 Demand for butter 2 10 20 32 Quantity of butter
Link Between Indifference Curve Budget Constraint Model and Demand Curve • The utility-maximizing quantities at each price level trace out the individual’s demand curve P $15 $10 $5 P=$15 P=$10 P=$5 Q Q 9 12 15 9 12 15
From Individual to Market Demand • Market demand is made up of the sum of individual demands Total Demand p p p p p D3 D1 D2 D4 15 Q 30 Q 25 Q 10 Q Q 80
Income-Consumption and Engel Curves Oranges Income Engel Curve Income-Consumption Curve 100 75 50 I = 100 I = 50 I = 75 1000 2000 2900 apples 1000 2000 2900 apples
Normal and Inferior Goods • Normal good - one whose quantity demanded rises as income rises • Inferior good - one whose quantity demanded falls as income rises Normal good Normal good Normal good Inferior good
Effect of a Price Change on Utility • Compensating Variation: The minimum change in income at the new prices that would make the consumer as well off as they were before the price change • Equivalent Variation: The minimum change in income at the old prices that would make the consumer as well off as they are after the price change
Compensating Variation Compensating Variation
Equivalent Variation Equivalent Variation
Income and Substitution Effects • The total impact of a price change on the demand for a product can be broken into the income and substitution effects • Income effect - the component of the total effect of a price change that results from the associated change in real purchasing power (quasi income) • Substitution effect - the component of the total effect of a price change that results from the associated change in the relative attractiveness (relative price) of the good in question • Giffen good is one for which the total effect of a price increase/decrease is to increase/decrease the demand for that good (counter intuitive effect) • Substitution effect is always in the same direction so a Giffen good is a strongly inferior good, so strongly inferior that the income effect is larger than the substitution effect
Effect of a Price Change: Normal Good All other goods apples Substitution effect Income effect
Effect of a Price Change: Inferior Good All other goods Spam Income effect Substitution effect
Effect of a Price Change: Giffen Good All other goods Potatoes Income effect Substitution effect
Price Elasticity • Price elasticity of demand - the percentage change in the quantity demanded that results from a 1 percent change in its price • Always less than zero by Law of Demand • The value of price elasticity tells whether demand is elastic, inelastic, or unitary elastic • Elastic • Inelastic • Unitary Elastic
Graphical Depiction of Price Elasticity Price Elastic 10 9 Inelastic 2 1 demand 1 2 9 10 Quantity
Elasticity Along a Demand Curve Price Elastic Unitary Elastic Inelastic demand Quantity
Other Elasticities • Income elasticity of demand - the percentage change in the quantity demanded that results from a 1 percent change in income (Y) • Cross-price elasticity - the percentage change in the demand for good X that results from a 1 percent change in the price of good Y
What Determines Price Elasticities • Substitution possibilities - greater number of substitutes makes goods more elastic • Budget share - greater share of expenditures accounted for by the product, the more elastic • Direction of income effect - normal goods will have higher price elasticities than inferior goods b/c the income effect reinforces the substitution effect • Time - the longer the time period in question, the greater the price elasticity
Price Elasticity and Total Revenue(Elastic) Losses in total revenue from lowering the price Price Gains in total revenue from lowering the price Quantity
Price Elasticity and Total Revenue(Inelastic) Price Losses in total revenue from lowering the price Gains in total revenue from lowering the price Quantity