1 / 0

Unit 2 – Demand, Supply and Markets

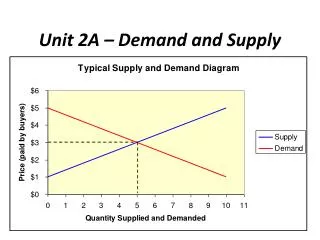
Unit 2 – Demand, Supply and Markets. CIE 3M0 – Individual and the Economy Mr . T. What is a Market?. It is a network that brings buyers and sellers together to exchange goods It is not always a physical market. Today, markets are often found on the internet, or over the telephone.

hana
Télécharger la présentation

Unit 2 – Demand, Supply and Markets

An Image/Link below is provided (as is) to download presentation Download Policy: Content on the Website is provided to you AS IS for your information and personal use and may not be sold / licensed / shared on other websites without getting consent from its author. Content is provided to you AS IS for your information and personal use only. Download presentation by click this link. While downloading, if for some reason you are not able to download a presentation, the publisher may have deleted the file from their server. During download, if you can't get a presentation, the file might be deleted by the publisher.

E N D

Presentation Transcript


  1. Unit 2 –Demand, Supply and Markets

    CIE 3M0 – Individual and the Economy Mr. T
  2. What is a Market? It is a network that brings buyers and sellers together to exchange goods It is not always a physical market. Today, markets are often found on the internet, or over the telephone. Any time that supply and demand determine price and quantity of goods sold, a market exists.
  3. Demand! Demand represents the quantity of goods or services that buyers are willing and able to purchase at various prices. The quantity demanded at each possible price can be shown using a demand schedule. Mr.Twill now draw this on the board. Economists love to gather demand data and represent it using a demand schedule. To make this info easier to understand, most people "demand" that it be displayed in graph form. This economist is likely engaged in making a demand graph!
  4. The Law of Demand When the price of a good is raised (and no other changes take place), demand will decrease. Likewise, when the price of a good is decreased, demand will increase.
  5. The Demand Curve P$ D Price 0 Q Quantity Demanded
  6. Law of Diminishing Marginal Utility Volunteer? As more items are consumed, they become less enjoyable. Eventually, a point will be reached where the consumer would prefer not to have any more of this once highly demanded item. Each additional unit of a good or service that is consumed brings less satisfaction or “utils” than the previous unit consumed This helps explain why the demand curve is downward sloping Remind you of the law of diminishing returns?
  7. Elastic and Inelastic Demand If any percentage change in price results in a greater percentage change in a product's quantity demanded  The product has ELASTIC DEMAND For Example: Waleed runs a lemonade stand year-round. In the winter, Waleed raises his price from $1.00 to $1.20. This is a price increase of 20%. When he does this, his business drops from 100 lemonades sold per day to 50. This is a quantity demanded decrease of 50%! We're talking serious elasticity here.
  8. But… What if the price increase took place in the summer? Waleed sells his lemonade for $1.00 year-round, but then raises the price to $1.20 in the summer (a 20% increase). When he does this, demand falls from 100 lemonades per day to 90 lemonades per day (a 10% decrease). This % change in quantity demanded is less than the % change in price. Now that's what I call INELASTIC DEMAND!
  9. EXTREME ECONOMICS!!!!1!!! In extreme cases, we can even see perfectly elastic demand. When this happens, price remains constant regardless of the quantities demanded. In the case of perfectly inelastic demand, quantity demanded is completely not affected by price. Can you think of any examples of these two situations?
  10. A Perfectly Elastic and a Perfectly Inelastic Demand Curve
  11. Elasticity of Demand(back by popular demand) Shows the effects of a change in price on the quantity demanded for a good or service. P x Qd = TR (total revenue) Elastic Demand – As price goes down, revenue goes up because there is greater demand % P < Qd (P -  TR + ) Inelastic Demand – Once price goes down far enough, total revenue no longer increases, as people will not spend more money when products are so cheap. P > Qd (P -  TR -) Unitary Demand – When this exists, a decrease in price results in an identical increase in demand (proportionately, as a percent) P = Qd (P -  TR n.c.)
  12. How does this cartoon represent Inelastic Demand?
  13. # of substitutes (What can the good or service be replaced with. e.g. margarine vs. butter) Items that are rarely purchased and usually do not cost much (e.g. pepper, salt) Essential items (e.g. water, electricity, natural gas) Time (e.g. when Mr.Harper almost ran out of gasoline the other day, he had no choice but to pay the current price) FACTORS EFFECTING ELASTICITY OF DEMAND
  14. Applications of Elasticity of Demand The government often uses elasticity of demand to increase their revenues. The more inelastic an item the more heavily it can successfully be used to raise tax revenue (e.g. cigarettes, gas & alcohol)
  15. Effect of an Increase in Demand P$ D1 D Price Level 0 Q Quantity
  16. An Increase In the Demand for Pineapples P $ D D1 $2.50 $2.00 Price $1.50 $1.00 $0.50 0 Q 5 10 15 20 25 Quantity Demanded (000’s)
  17. Effect of a Decrease in Demand P$ D D0 Price Level 0 Q Quantity Demanded
  18. A decrease In the Demand for Pineapples P $ D D0 $2.50 $2.00 Price $1.50 $1.00 $0.50 0 Q 5 10 15 20 25 Quantity Demanded (000’s)
  19. Questions to ponder Answer the following questions from your textbook: Page 119: # 4,5,6,7 This must be completed by tomorrow!
  20. Article: To Florida citrus growers a freeze is a blessing "Cold eases the fear of a bumper-crop surplus resulting in money loss" The freezing weather in Florida's citrus belt will reduce this year's previously predicted bumper crop…but ironically it will ease the worries of growers who had feared they would lose money because of the surplus. "Nature has bailed us out of a bumper crop," a spokesperson for the Florida Citrus Commission said yesterday in a telephone interview. "The growers were going to lose money, but now the problem has been taken care of and an over-supply situation has been corrected." – New York Times, Jan 23, 1977.
  21. What can we infer from these events about the elasticity of demand for citrus fruits in general, and oranges in particular? Why was the freeze "a blessing" to Florida citrus growers?
  22. The Supply Curve Supply The quantities of a good or service that sellers are willing and able to sell at various prices Similar to demand, supply can be shown as a schedule and then as a graph
  23. The Law of Supply Law of Supply Increase in price (P) will increase quantity supplied (Qs) Decrease in price (P) will decrease quantity supplied (Qs) Direct relationship between P and Qs
  24. An Increase In the Supply of Pineapples P $ S S1 $2.50 $2.00 Price $1.50 $1.00 $0.50 0 Q 5 10 15 20 25 Quantity Supplied (000’s)
  25. An Increase In the Supply of Pineapples An increase in supply is represented by a shift in the supply curve to the right (S1). At each price point, producers are willing to supply more goods. For example, at $1.00, producers were supplying 10,000 units. Now producers are willing to supply 15,000 (an increase of 5,000 units)
  26. A Decrease in the Supply of Pineapples P $ S0 S $2.50 $2.00 Price $1.50 $1.00 $0.50 0 Q 5 10 15 20 25 Quantity Supplied (000’s)
  27. Causes For Demand Shifting 1. Market Size 2. Income 3. Price of Substitutes / Complements 4. Tastes 5. Consumer Expectations Causes For Supply Shifting 1. Weather Conditions 2. Production Resource Price 3. Technology 4. Productivity of Labour 5. Number of Producers What causes Demand & Supply curves to shift?
  28. Mr. T, remember when we talked about elasticity of demand? Can we do that for supply too? I liked it a lot. Sure thing. When we have elastic supply, a certain % change in a product's price, results in a larger % change in the quantity supplied. The quantity that producers are willing to offer for sale is very responsive to price changes. For example, if the price of lemons increases from $2 to $3 per kg (a 50% increase), the quantity supplied increases from 100 000 to 200 000 kg (a 100% increase). That's elastic supply! If the price of lemons increases by 50% and the quantity supplied only goes up from 100 000 to 120 000 (a 20% increase), we have inelastic supply.
  29. All this price elasticity could result in massive craziness, no? Yes, but we rely on our government to implement price controls. Governments often set Price Floors and Price Ceilings on important items. These are minimum and maximum allowable prices that can be charged for certain items What types of items do you think have price controls in Canada? How about in other countries?
  30. Price Supports Governments often provide Agricultural Price Supports to farmers because inelastic demand and supply can lead to massive price changes when quantity changes by only a small amount. When a shortage of wheat occurs, bread gets very expensive. Governments subsidize farmers to control this. Governments also implement Rent Controls to make sure that if there is a small change in quantity supplied or demanded for rental housing, landlords can't raise rents by more than a previously set amount (usually tied to inflation).
  31. T-Shirt Design Based on class demand, you will draw a demand curve for your T-shirt design. Your graph should demonstrate how many people would be willing to pay 0,5,10,15,20,25, and 30 dollars for your shirt. In analyzing your graphs, answer the following questions: At what price will you sell no shirts? (use your line of best fit) At what price would you maximize revenue?
  32. Market Equilibrium The point where the supply curve and the demand curve intersect At this point, Qd = Qs (quantity demanded = quantity supplied)
  33. Market EquilibriumSupply=Demand P$ S D Price 0 Q Quantity
  34. Equilibrium in the Market for Pineapples P $ D S $2.50 $2.00 Price $1.50 $1.00 $0.50 0 Q 5 10 15 20 25 Quantity (000’s)
  35. An Increase in the Demand for Computers 5 (Hundreds of dollars) D2 Shortage of 100 300 (thousands)
  36. At the original price of $400 per computer, there would be a shortage of 100 computers with the new demand curve (D2). To alleviate this shortage, price would have to increase to $500 per computer.
  37. A Decrease in the Demand for Computers Surplus of 100 (Hundreds of dollars) 3 D0 200 (thousands)
  38. An Increase in the Supply of Computers Surplus of 100 S2 (Hundreds of dollars) 3 300 (thousands)
  39. Video Determining Price clip from “Economics: Business Concepts” by Tele-Film. V34224
  40. A Decrease in the Supply of Computers S0 5 (Hundreds of dollars) Shortage of 100 200 (thousands)
  41. Some Supply and Demand Questions Just before Christmas, the Nintendo Wii Fit was the "must have gift" for many Canadians. Enterprising economists were able to buy some of these machines and sell them online throughout December for up to $200 (significantly more than retail). What is likely to happen to this price in January? February? July? Leather jackets with patches on the sleeves usually sell for $80. What happens when the Jonas Brothers start wearing these jackets for all of their TV appearances? When a guitar manufacturer announces that it will no longer make its most popular model of guitar, what do you think will happen to the price of this guitar? Our school cafeteria sells delicious chocolate chip cookies. What would happen if equally delicious chocolate chip cookies were sold by a cookie vendor at the front doors of the school?
  42. "I demand more questions!" Mr.Harper has a large supply. Read chapter 6 in our textbook Answer questions: 1-5 on pages 133-135
More Related