Download
1 / 18
180 likes | 370 Vues
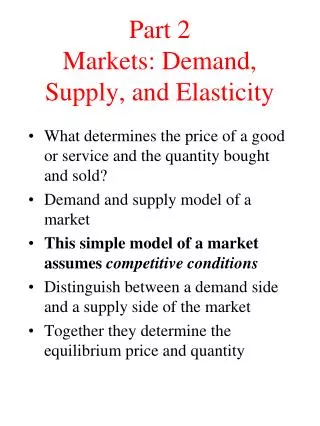
Demand, Supply, and Markets. The demand curve The supply curve Market equilibrium and disequilibrium Comparative statics Price floors Price ceilings . Demand and the Law of Demand.

E N D
Demand, Supply, and Markets The demand curve The supply curve Market equilibrium and disequilibrium Comparative statics Price floors Price ceilings
Demand and the Law of Demand Demand is the relation between the price of a good and the quantity that consumers are willing and able to buy per period, other things constant. Law of demand: The quantity of a good that consumers are willing and able to buy per period relates inversely, or negatively, to the price, other things constant.
Substitution effect of a price change When the price of a good falls, that good becomes cheaper relative to (related) goods, so consumers tend to substitute that good for other goods. I’m taking the subway more because cab fares have gone up
Income effect of a price change A fall in the price of a good increases consumers’ real income . The spike in gas prices has generated a negative income effect.
a $15 12 b c Price per pizza 9 d 6 e 3 D 0 8 14 20 26 32 Millions of pizzas per week The demand schedule and demand curve for pizza (b) Demand curve (a) Demand schedule The market demand D shows the quantity of pizza demanded, at various prices, by all consumers. Price and quantity demanded are inversely related.
Demand versus quantity-demanded Quantity-demanded is the amount of a good buyers are willing and able to but at a specific price, other things constant. Quantity-demanded at a price of $12 is 14 million pizzas per week Price per pizza $12 Demand 0 14 Millions of pizzas
The demand for good X depends on The price of good X The price of substitutes The price of complements Income Other factors
$15 b 12 Price per pizza 9 6 f 3 D D’ 0 8 14 20 26 32 Millions of pizzas per week An increase in the market demand for pizza An increase in the demand for pizza is shown by a rightward shift of the demand curve, so the quantity demanded increases at each price.
S $15 12 Price per pizza 9 6 3 0 12 16 20 24 28 Millions of pizzas per week The supply schedule and supply curve for pizza (b) Supply curve (a) Supply schedule The market supply S shows the quantity of pizza supplied, at various prices, by all pizza makers. Price and quantity supplied are directly related.
S’ S $15 g 12 h Price per pizza 9 6 3 0 12 16 20 24 28 Millions of pizzas per week An increase in the supply of pizza An increase in the supply of pizza is reflected by a rightward shift of the supply curve, from S to S’. Quantity supplied increases at each price level.
Equilibrium in the pizza market (a) Market schedules
Equilibrium in the pizza market S $15 Surplus 12 Price per pizza c 9 6 D Shortage 3 0 14 16 20 24 26 Millions of pizzas per week Market equilibrium occurs at: Price where QD=QS; Point c (b) Market curves Above the equilibrium price: QS>QD; Surplus; Downward pressure on P Below the equilibrium price: QD>QS; Shortage; Upward pressure on P
Effects of an increase in demand S Price per pizza g $12 c 9 D’ D 0 20 24 30 Millions of pizzas per week Increase in demand: Rightward shift to D’ At P=$9: QD>QS; shortage Upward pressure on P QD decreases QS increases New equilibrium g Higher P Higher Q
Effects of an increase in supply S S’ c Price per pizza $9 6 d D 0 20 26 30 Millions of pizzas per week Increase in supply: Rightward shift to S’ At P=$9: QS>QD; surplus Downward pressure on P QD increases QS decreases New equilibrium d Higher Q Lower P
(b) Shift of S dominates (a) Shift of D dominates S S Price Price S’ S’’ p’ b a a p p D’ p’’ c D’’ D D 0 Q Q’’ 0 Q Q’ Units per period Units per period Indeterminate effect of an increase in both D and S
Change in demand Change in supply Effects of both demand and supply
S2007 $4.9 • S – relatively fixed • Big jump in D • Average pay increased from $170,000 in 1980 to 4,900,000 in 2007. • Number of teams in NBA increased • Number of players increased from 300 to 450. 4.0 D2007 3.0 Average pay per season (millions) 2.0 D1980 S1980 1.0 0.17 450 400 300 200 100 0 Players per season NBA pay leaps