Download
1 / 50
500 likes | 710 Vues
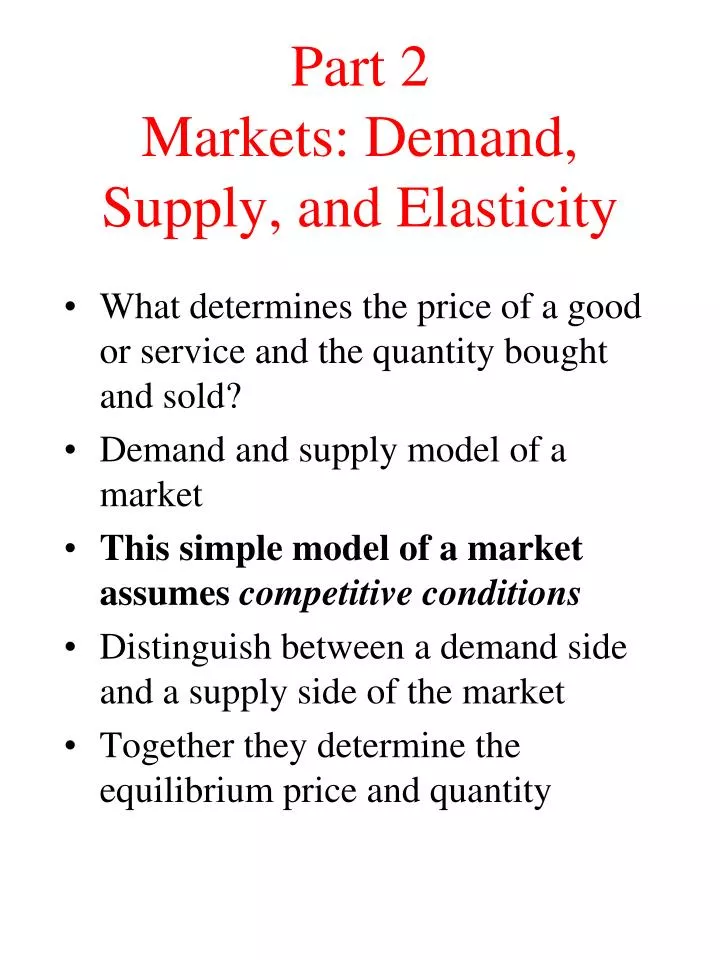
Part 2 Markets: Demand, Supply, and Elasticity. What determines the price of a good or service and the quantity bought and sold? Demand and supply model of a market This simple model of a market assumes competitive conditions Distinguish between a demand side and a supply side of the market

E N D
Part 2Markets: Demand, Supply, and Elasticity • What determines the price of a good or service and the quantity bought and sold? • Demand and supply model of a market • This simple model of a market assumes competitive conditions • Distinguish between a demand side and a supply side of the market • Together they determine the equilibrium price and quantity
Demand • Demand is the quantity of a good people purchase over a given time • The quantity of a good a person will plan to purchase will depend on: - Preferences (tastes) - Price of the good - Prices of other goods - Expected future prices - Income • In the aggregate, demand will also depend on: - Population and demographics
The Law of Demand • Other things remaining the same, the higher the price of a good, the smaller is the quantity demanded • Substitution effect—the effect of the change in relative price • Income effect—the effect of the change in overall purchasing power
Demand Function and Demand Curves • Demand function—demand as a function of a number of variables • Demand curve—demand as a function of price, everything else held constant • What is held constant along a demand curve? • Changes in the quantity demanded—movements along the demand curve
Changes in Quantity Demanded P Decrease in quantity demanded P’ P Increase in quantity demanded P” Q” Q’ Q Q Change in quantity demanded—a movement alongthe demand curve
Demand Curves • Can be linear or non-linear • A linear demand curve P P = a + bQ Where a is the P intercept and b is the slope variable and is negative 20 30 Q P = 20 - 2/3Q
Demand Curves • A demand curve is more usually written with Q as the dependent variable P Q = a + bP Where a is the Q intercept and b is the inverse of the slope and is negative 20 Q 30 Q = 30 – 3/2P
Changes in Demand • Shift in a demand curve is a Change in Demand • Change in tastes or preferences • Change in the prices of other goods - substitutes - complements • Changes in expected future prices • Changes in income - normal goods - inferior goods • Changes in population/demographics
An Increase in Demand • An increase in demand—a rightward shift P D’ D Q
An Increase in Demand • Price of a substitute rises • Price of a complement falls • Expected future price rises • Income rises (normal good) or income falls (inferior good) • Preferences move toward the good • Population increases
A Decrease in Demand • A decrease in demand—a leftward shift P D D’ Q
A Decrease in Demand • Price of a substitute falls • Price of a complement rises • Expected future price falls • Income falls (normal good) or income rises (inferior good) • Preferences move away from the good • Population falls.
Supply • Supply is the quantity of a good firms produce over a given time • The firm has to have the resources and technology to produce the good • The firm has to think it can produce the good at a profit (at least in the long run) • Short run and long run supply decisions
Supply • The amount of any particular good or service supplied by a firm will depend on: - The price of the good - The prices of inputs needed to produce the good - The available technology - The available capital (short run) - Prices of other goods - Expected future prices • In the aggregate, supply will also depend on: - The number of firms in the market
The Law of Supply • Other things remaining the same, the higher the price of a good, the greater will be the quantity supplied • Higher prices mean it will be profitable to expand production • With rising marginal costs higher prices are required for firms to be willing to increase production
Supply Functions and Supply Curves • Supply function • Supply curve—shape • Supply curves can only be defined for competitive industries (where price is a given to the firm) • What is held constant along a supply curve? • Changes in the quantity supplied—movements along the supply curve
Changes in Quantity Supplied P S P” Increase in quantity supplied P P’ Decrease in quantity supplied Q” Q’ Q Q Change in quantity supplied—a movement alongthe supply curve
Supply Curves A linear supply curve: P = a + bQ where a is the P intercept And b is the slope which is positive P S Slope is = 2 10 Q P = 10 + 2Q
Supply Curves Supply curves are more usually written with Q as the dependent variable: Q = a + bP where a is the Q intercept and b is the inverse of the slope and positive P S Slope = 2 inverse of Slope = 1/2 10 Q = -5 + ½ P -5 0 Q
Changes in Supply • Shift in a supply curve is a Change in Supply • Change in input prices • Changes in technology • Changes in expected future prices • Change in the scale of the firm • Changes in the number of firms—entry and exit of firms
An Increase in Supply An increase in supply—a rightward shift in the supply curve S S’ P Q
An Increase in Supply • Price of inputs fall • More efficient technology • Expected future price fall (ie natural resource production) • Firms grow in size • Number of firms in the industry grows
A Decrease in Supply P S’ S Q A decrease in supply is a leftward shift in the supply curve
A Decrease in Supply • Price of inputs rise • Expected future price rise (natural resources) • Loss of technological knowledge • Firms decline in size • Number of firms in the industry shrinks
Market Equilibrium • Market equilibrium is where demand = supply • Equilibrium price • Equilibrium quantity • Price adjusts to bring about an equilibrium • If D>S price rises which reduces quantity demanded and increases quantity supplied • If S>D price falls which increases quantity demanded and reduces quantity supplied
Market Equilibrium P Surplus- price falls S E P* Shortage- Price rises D Q* Q
Market Equilibriumin Equations • Demand curve D = a + bP where a is the Q intercept and b is the inverse of the slope (and negative) • Supply Curve S = c + dP where c is the Q intercept (usually zero or negative) and b the inverse of the slope and positive • In equilibrium D = S • Solve for P* then Q*
Market Equilibriumin Equations • Demand curve D = 400 – .5P • Supply Curve S = – 200 + 1P • Solve for P* • 400 – .5P* = – 200 + 1P* • 600 = 1.5P* • P* = 400 • Solve for Q* • Q* = 400 – 200 • Q* = 200
Market Equilibrium in Equations P Diagram of the equations 800 S = -200 + 1P 400 D = 400 - .5P Q -200 200 400
Equilibrium Price and Quantity Changes • A change in demand with a given supply curve P S E’ P’ E P D’ D Q Q’ Q • Rightward shift in demand leads to a movement • along the supply curve. P and Q both rise.
Equilibrium Price and Quantity Changes • A change in supply with a given demand curve S P S’ E P E’ P’ D Q Q’ Q • A rightward shift in supply leads to a • movement along the demand curve. P falls • and Q rises.
Equilibrium Price and Quantity Changes • A change in supply and demand • —same directions S P S’ E’ E P D’ D Q Q Q’ • A rightward shift in both demand and supply • leads to a higher Q. P may rise, fall, or stay • the same.
Equilibrium Price and Quantity Changes • A change in supply and demand • —opposite directions P S S’ E P E’ D P’ D’ Q Q • A rightward shift in supply and a leftward • shift in demand leads to a lower P. Q may rise, • fall, or stay the same.
An Example • From Slate Magazine June 2009 in a discussion of a campaign by Chevron to get people to drive less: “All other things being constant, if every gullible soul performed the conservation miracles Chevron proposes, energy consumption would fall, and so would prices. As prices fell the non-gullible would take advantage of the depressed prices to consume more and thus drive the price back up.” Is this right?
Elasticity • Elasticity is a measure of responsiveness • Many elasticities can be measured: price elasticity of demand, cross price elasticity of demand, income elasticity of demand, and elasticity of supply • Elasticity measures are measures of proportionate responsiveness and are unit free
Elasticity • General form: The elasticity of X with respect to Y is given by the % or proportionate change in X divided by the % or proportionate change in Y • EXY = % Δ X / % Δ Y or • EXY= ΔX/X / ΔY/Y or • EXY=ΔX/ΔY • Y/X
Price Elasticity of Demand • Elasticity of Demand with respect to the good’s own price • EDxPx= %ΔQ/%ΔP or • EDxPx= ΔQ/Q / ΔP/P or • EDxPx= ΔQ/ΔP • P/Q • For price elasticities of demand the sign is ignored as they are all negative • Elastic demand > 1 • Inelastic demand < 1 • Unit elastic demand = 1
Inelastic and Elastic Demand D P Elasticity = 0 Q P D Elasticity = Q P Elasticity = 1 D Q
Price Elasticity of Demand Over an Arc Px ($) If measuring price elasticity of demand over an arc use the average P and Q 15 5 12.5 10 100 Dx Qx (Kgs) 200 100 150 EDxPx= 100/150 / 5/12.5 = .66/.4 = 1.66 EDxPx= 100/5 x 12.5/150 = 20 x .083 = 1.66
Price Elasticity of Demand at a Point EDxPx= ΔQ/ΔP • P/Q ΔQ/ΔP = inverse of the slope of the demand curve P 100 Slope = 2 Inverse of slope = 0.5 Elasticity = 0.5 x 4 = 2 80 D 50 20 Q
Price Elasticity Along a Straight Line Demand Curve P Slope = 2/3 Inverse of slope = 1.5 EDxPx > 1 200 EDxPx = 1 100 EDxPx < 1 Q 150 300 EDxPx > 1 Elastic Demand EDxPx = 1 Unit Elastic Demand EDxPx < 1 Inelastic Demand
Price Elasticity of Demand and Total Revenue • If the price elasticity of demand is > 1, then a reduction in price will increase quantity demanded more than proportionately and TR (P x Q) will increase. • If the price elasticity of demand = 1, then a reduction in price will increase quantity demanded in proportion and TR will be unchanged • If the price elasticity of demand is < 1, then a reduction of price will increase quantity demanded less than proportionately and TR will fall.
Price Elasticity of Demand and Total Revenue P E > 1 E = 1 E < 1 D Q TR Max TR TR rising TR falling Q
Factors that Affect Price Elasticity of Demand • The closeness of substitutes - the more close substitutes the higher the price elasticity of demand • The proportion of income spent on the good - the higher the proportion of income spent on the good the higher the price elasticity of demand • The time elapsed - The more time elapsed the more elastic the demand
Cross Price Elasticity of Demand • The elasticity of the demand for good X with respect to the price of another good Y • EDxPy= %ΔQX/%ΔPY or • EDxPy= ΔQX/QX / ΔPY/PY or • EDxPy= ΔQX/ΔPY • PY/QX • The sign matters, positive cross price elasticities indicate substitutes, negative cross price elasticities indicate complements
Complements and Substitutes The demand curve for good X shifts with changes in the price of good Y P Price of a complement falls Price of a substitute rises D’ Price of a complement rises Price of a substitute falls D D” Q
Income Elasticity of Demand • The elasticity of demand for good X with respect to income (I) • EDxI= %ΔQX/%ΔI or • EDxI= ΔQX/QX / ΔI/I or • EDxI= ΔQX/ΔI • I/QX • EDxI > 1 normal and income elastic • EDxI < 1 > 0 normal and income inelastic • EDxI <0 inferior good • Necessaries, luxuries and income levels
Elasticity of Supply • The elasticity of the supply of good X with respect to its own price • ESxPx= %ΔQS/%ΔP or • ESxPx= ΔQS/QS / ΔP/P or • ESxPx= ΔQS/ΔP • P/QS • Elasticities of supply can range from zero to infinity. Depends on technology, resource substitution, and time frame • All straight line supply curves through the origin will have elasticities of supply = 1
Elasticity of Supply P S 50 10 40 100 Q 200 100 ESxPx = 100/10 x 45/150 = 3
An Example • Times Colonist editorial concerning BC Ferry fares, July 2009: “Increased fares have resulted in fewer passengers. BC Ferries own figures indicate an 8% rise in fares results in a 2.25% drop in travel. Last year fares rose by 7.3%. Fewer passengers means less revenue for the Corporation and more fare increases. It is the start of a vicious cycle.” Is this correct?