Bioinformatics: Analysis and Clustering Techniques for Gene Expression Study
Learn about gene expression analysis, finding significant genes, gene classification, overrepresentation exercises, clustering methods, GO organization, and supervised learning in bioinformatics. Practice array quality assessment, dChip exercises, explore gene ontology, and understand clustering techniques. Enhance your understanding of biological processes, molecular functions, and cellular components. Discover how to use different clustering algorithms and data grouping methods.

Bioinformatics: Analysis and Clustering Techniques for Gene Expression Study
E N D
Presentation Transcript
Expression analysis 2 Introduction to Bioinformatics morten@binf.ku.dk
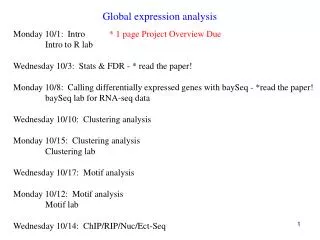
Program • Jeppe Vinther • Array quality • Finding significantly expressed genes • Spreadsheet exercise • dChip exercise • Overrepresented gene sets • dChip exercise • Web exercise (DAVID) • Clustering • Distance measure exercise • Clustering in dChip exercise
Array quality • Open the CEL-image for MCF7-AV_b_A • Look for artefacts • Also check the others
Finding significant genes • Often a combination of • P-value from t-statistics • High variability requires more replicates • Fold change • Demonstrate in dChip • You do it! • Take a look at the resulting spreadsheet
Putting genes into classes • What can we do with our list of genes? All genes angiogenesis On Y-chr Tyrosin-kinases Targeted to mitochondria Our genes Skeletal development Glycolysis DNA replication Upregulated in brainstem
Gene ontology • Effort to categorize gene products using a controlled vocabulary • Three organising principles (cytochrome c) • Molecular function (oxidoreductase activity) • Biological process (oxidative phosphorylation, induction of cell death) • Cellular component (mitochondrial matrix, mitochondrial inner membrane)
Organisation of GO • Example: Interleukin-12 • Directed acyclic graph • Note the GOIDs • Tools for finding overrepresented GO terms in a set of genes • dChip • EASE • DAVID • …many more
Other classification schemes • GO • Pathways – the KEGG database • Protein domains (from PFAM) • Chromosomal location
Overrepresentation exercises • ”classify genes” in dChip • Find overrepresented annotation in upregulated genes. Instructions in the handouts • DAVID • Do the same here
Why cluster? • To find genes that behave similarily • Perhaps they have a common regulator? • To find samples that are similar • E.g. Discover subtypes of disease samples.
Have you seen these? Experiments can also be clustered Ring a bell? 1 row = 1 expression vector Similar rows are grouped or clustered
Agglomerative clustering 0 1 2 3 4 a a,b b c d e
Agglomerative clustering 0 1 2 3 4 a a,b b c d d,e e
Agglomerative clustering 0 1 2 3 4 a a,b b c c,d,e d d,e e
Agglomerative clustering 0 1 2 3 4 a a,b b a,b,c,d,e c c,d,e d d,e e … and the tree is constructed
Expression vectors • Each gene can be represented as a point in space • Dimension of the space = the number of different experiments
Requirement for hierachical clustering • A distance matrix!! • Rings a bell from phylogeny?
Distance measures • Euclidian metrics • Non-euclidean metrics • Semimetric distances
c b a Euclidean metric (x1,y1) a2 + b2 = c2 (x2,y2) Generalised to n dimensions
Requirements for a metric Non-negative Symmetric Distance to self is zero Triangle inequality
Non-euclidean metrics Manhattan metric
Semimetric distance - correlation • Similarity inversely related to distance • 1 – similarity measure
Clustering of high dimensional data • Unsupervised learning of patterns in the data • Hierarchical clustering • K-means clustering • Self-organising maps
Mini exercise • Calculate different distance measures in a spreadsheet
Mini exercise • Try hierachical clustering in dChip • Do point 11 and 12 in the handouts • Try using different distance measures • Try exporting branches of the tree (Clustering->export branch) and do functional classification of those • Walkthrough afterwards
Other ways of grouping data points • Hierachical clustering => builds a tree • K-means => partitions points into k groups • Self organising maps (a.k.a Kohonen maps) • demo
Clinical goals • Improve the diagnostic categorization • Identify useful predictive markers for outcome and therapeutic response • Identify points for intervention: • critical pathways • drug targets Supervised learning
Training set Negative examples (not ovarian cancers) Positive examples (ovarian cancers) Machine Learning I think this is an ovarian cancer! (confidence is xxx) ”Machine” Unknown sample Neural networks Linear discriminant analysis K-nearest neighbours Support vector machines …
A typical (easy) sample set II Easy to distinguish by one measurement per individual.
A harder sample set I We can tell apples from oranges. But can we distinguish different kinds of apples?
kNN K=4 • Of the 4 nearest neighbours: • 3 are green • 1 is red • So we conclude that ? Is green ?
Error on training set Error on testset cross validation Performance of machine learning • How correctly does it predict known examples? • Beware of overtraining • Assess performance on data not used for training
Microarray summary • Very powerful technology – measure all genes • Noise issues. Lots of data more possibilities for wrong data • Results are not the ”truth” but hypothesis for testing • Statistical significance != biological significance • Change in analysis will change results • Important to try different things and use judgement • Test your hypothesis using different approaches – the more different the better. • You have only scraped the surface – so when faced with problems, seek assistance
Other uses of microarrays • DNA targets • Copy number analysis • SNP detection • Tiling arrays • Whole genome for transcript mapping • Promotor regions for chromatin immunoprecipitation