Chapter 5 RNA Expression Analysis
Chapter 5 RNA Expression Analysis. Determining genome-wide RNA expression levels. Contents. Genome-wide RNA expression analysis Northern blotting Types of microarrays Making microarrays Hybridization to microarrays Microarray experiments SAGE (Serial Analysis of Gene Expression),

Chapter 5 RNA Expression Analysis
E N D
Presentation Transcript
Chapter 5RNA Expression Analysis Determining genome-wide RNA expression levels © 2005 Prentice Hall Inc. / A Pearson Education Company / Upper Saddle River, New Jersey 07458
Contents • Genome-wide RNA expression analysis • Northern blotting • Types of microarrays • Making microarrays • Hybridization to microarrays • Microarray experiments • SAGE (Serial Analysis of Gene Expression), • MPSS™ (Massively Parallel Signature Sequencing), • Real-time RT-PCR © 2005 Prentice Hall Inc. / A Pearson Education Company / Upper Saddle River, New Jersey 07458
Genome-wide expression analysis • Goal: to measure RNA levels of all genes in genome • Steady-state RNA levels vary with the following: • Cell type • Developmental stage: program • External stimuli: heat and cold etc. • Time (when) and location (where) of expression provide useful information as to gene function. Temporal and spatial • Misconception: More is Merrier! • Problem: Its only RNA not protein © 2005 Prentice Hall Inc. / A Pearson Education Company / Upper Saddle River, New Jersey 07458
Genomics expression analysis methods • Microarrays • Hybridization based • SAGE (Serial Analysis of Gene Expression) • Sequence fragments of cDNAs • MPSS (Massively Parallel Signature Sequencing) • Combines hybridization and sequencing • Real-time PCR © 2005 Prentice Hall Inc. / A Pearson Education Company / Upper Saddle River, New Jersey 07458
Hybridization • Measurements of RNA abundance by microarrays based on hybridization • Between complementary strands of RNA and DNA • Or two complementary DNA strands • Similar in principle to RNA blot (Northern blot) © 2005 Prentice Hall Inc. / A Pearson Education Company / Upper Saddle River, New Jersey 07458
Northern blot – + • Electrophoresis of RNA through gel • Transfer of RNA to solid support • Nylon or nitrocellulose • Intensity of hybridization signal • Approximately equal to amount of RNA gel © 2005 Prentice Hall Inc. / A Pearson Education Company / Upper Saddle River, New Jersey 07458
Hybridization issues • RNA integrity must be verified • If RNA degraded, hybridization not quantitative • Probe must be in excess of bound RNA • Hybridization kinetics govern reaction • Hybridization must be for a sufficient time to allow probe to find target RNA • Comparison between samples requires loading control © 2005 Prentice Hall Inc. / A Pearson Education Company / Upper Saddle River, New Jersey 07458
target – loading – control Northern blots vs. microarrays • Global expression analysis: microarrays • RNA levels of every gene in the genome analyzed in parallel • Global expression analysis: Northern blot • Limited by number of lanes in gel © 2005 Prentice Hall Inc. / A Pearson Education Company / Upper Saddle River, New Jersey 07458
Basics of microarrays • DNA attached to solid support • Glass, plastic, or nylon • RNA is labeled • Usually indirectly • Bound DNA is the probe • Labeled RNA is the “target” © 2005 Prentice Hall Inc. / A Pearson Education Company / Upper Saddle River, New Jersey 07458
samples mRNA cDNA DNA microarray Microarray hybridization • Usually comparative • Ratio between two samples • Examples • Tumor vs. normal tissue • Drug treatment vs. no treatment • Embryo vs. adult © 2005 Prentice Hall Inc. / A Pearson Education Company / Upper Saddle River, New Jersey 07458
How microarrays are made: spotted microarrays • DNA mechanically placed on glass slide • Need to deliver nanoliter to picoliter volumes • Too small for normal pipetting devices • Robot “prints,” or “spots,” DNA in specific places © 2005 Prentice Hall Inc. / A Pearson Education Company / Upper Saddle River, New Jersey 07458
DNA spotting I • DNA spotting usually uses multiple pins • DNA in microtiter plate • DNA usually PCR amplified • Oligonucleotides can also be spotted © 2005 Prentice Hall Inc. / A Pearson Education Company / Upper Saddle River, New Jersey 07458
DNA spotting II • Pins dip into DNA solution in microtiter wells • Robot moves pins with DNA to slides • Robot “prints” DNA onto slide • DNA sticks to slide by hydrostatic interactions • Same spots/DNA usually printed at different locations • Serves as internal control • Pins washed between printing rounds • Hundreds of slides can be printed in a day © 2005 Prentice Hall Inc. / A Pearson Education Company / Upper Saddle River, New Jersey 07458
Commercial DNA spotter © 2005 Prentice Hall Inc. / A Pearson Education Company / Upper Saddle River, New Jersey 07458
Movie of microarray spotting © 2005 Prentice Hall Inc. / A Pearson Education Company / Upper Saddle River, New Jersey 07458
How microarrays are made:Affymetrix GeneChips • Oligonucleotides synthesized on silicon chip • One base at a time • Uses process of photolithography • Developed for printing computer circuits © 2005 Prentice Hall Inc. / A Pearson Education Company / Upper Saddle River, New Jersey 07458
Affymetrix GeneChips • Oligonucleotides • Usually 20–25 bases in length • 10–20 different oligonucleotides for each gene • Oligonucleotides for each gene selected by computer program to be the following: • Unique in genome • Non-overlapping • Composition based on design rules • Empirically derived © 2005 Prentice Hall Inc. / A Pearson Education Company / Upper Saddle River, New Jersey 07458
lamp mask chip Photolithography • Light-activated chemical reaction • For addition of bases to growing oligonucleotide • Custom masks • Prevent light from reaching spots where bases not wanted • Mirrors also used • NimbleGen™ uses this approach © 2005 Prentice Hall Inc. / A Pearson Education Company / Upper Saddle River, New Jersey 07458
light Example: building oligonucleotides by photolithography • Want to add nucleotide G • Mask all other spots on chip • Light shines only where addition of G is desired • G added and reacts • Now G is on subset of oligonucleotides © 2005 Prentice Hall Inc. / A Pearson Education Company / Upper Saddle River, New Jersey 07458
light Example: adding a second base • Want to add T • New mask covers spots where T not wanted • Light shines on mask • T added • Continue for all four bases • Need 80 masks for total 20-mer oligonucleotide © 2005 Prentice Hall Inc. / A Pearson Education Company / Upper Saddle River, New Jersey 07458
Ink-jet printer microarrays • Ink-jet printhead draws up DNA • Printhead moves to specific location on solid support • DNA ejected through small hole • Used to spot DNA or synthesize oligonucleotides directly on glass slide • Use pioneered by Agilent Technologies, Inc. © 2005 Prentice Hall Inc. / A Pearson Education Company / Upper Saddle River, New Jersey 07458
Comparisons of microarrays Oligo spotted Ink jet © 2005 Prentice Hall Inc. / A Pearson Education Company / Upper Saddle River, New Jersey 07458
Comparison of microarray hybridization • Spotted microarrays • Competitive hybridization • Two labeled cDNAs hybridized to the same slide • Affymetrix GeneChips • One labeled RNA population per chip • Comparison made between hybridization intensities of same oligonucleotides on different chips © 2005 Prentice Hall Inc. / A Pearson Education Company / Upper Saddle River, New Jersey 07458
Target labeling: fluorescent cDNA • cDNA made using reverse transcriptase • Fluorescently labeled nucleotides added • Labeled nucleotides incorporated into cDNA © 2005 Prentice Hall Inc. / A Pearson Education Company / Upper Saddle River, New Jersey 07458
Target labeling: cRNA + biotin • cDNA made with reverse transcriptase • Linker added with T7 RNA polymerase recognition site • T7 polymerase added and biotin labeled RNA bases • Biotin label incorporated into cRNA + © 2005 Prentice Hall Inc. / A Pearson Education Company / Upper Saddle River, New Jersey 07458
Labels • Cy3 green and Cy5 red • Fluoresce at different wavelengths • Used for competitive hybridization • Biotin • Binds to fluorescently labeled avidin • Used with Affymetrix GeneChips © 2005 Prentice Hall Inc. / A Pearson Education Company / Upper Saddle River, New Jersey 07458
Spotted-microarray hybridization • Control and experimental cDNA labeled • One sample labeled with Cy3 • Other sample labeled with Cy5 • Both samples hybridized together to microarray • Relative intensity determined using confocal laser scanner • Reverse the label © 2005 Prentice Hall Inc. / A Pearson Education Company / Upper Saddle River, New Jersey 07458
Scanning of microarrays • Confocal laser scanning microscopy • Laser beam excites each spot of DNA • Amount of fluorescence detected • Different lasers used for different wavelengths • Cy3 • Cy5 laser detection © 2005 Prentice Hall Inc. / A Pearson Education Company / Upper Saddle River, New Jersey 07458
Analysis of hybridization • Results given as ratios • Images use colors: Cy3 = Green Cy5 = red Yellow • Yellow is equal intensity or no change in expression © 2005 Prentice Hall Inc. / A Pearson Education Company / Upper Saddle River, New Jersey 07458
Example of spotted microarray • RNA from irradiated cells (red) • Compare with untreated cells (green) • Most genes have little change (yellow) • Gene CDKN1A: red = increase in expression • Gene Myc: green = decrease in expression CDKNIA MYC © 2005 Prentice Hall Inc. / A Pearson Education Company / Upper Saddle River, New Jersey 07458
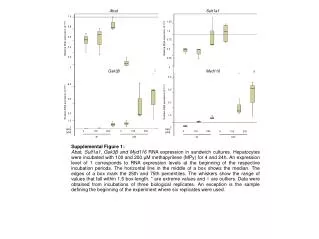
Analysis of cell-cycle regulation • Yeast cells stopped at different stages of cell cycle • G1, S, G2, and M • RNA extracted from each stage • Control RNA from unsynchronized culture © 2005 Prentice Hall Inc. / A Pearson Education Company / Upper Saddle River, New Jersey 07458
Results of cell-cycle analysis • 800/6000 genes identified whose expression changes during cell cycle • Grouped by peak expression • M/G1, G1, S, G2, and M • Four different treatments used to synchronize cells • All gave similar results • Results from Spellman et al., 1998; Cho et al., 1998 © 2005 Prentice Hall Inc. / A Pearson Education Company / Upper Saddle River, New Jersey 07458
Alpha cdc15 cdc28 Elu M/G1 G1 S G2 M Brown and Botstein, 1999 Cell-cycle regulated genes treatments • Each gene is a line on the longitudinal axis • Treatments in different panels • Cell-cycle stages are color coded at top • Vertical axis groups genes by stage in which expression peaks © 2005 Prentice Hall Inc. / A Pearson Education Company / Upper Saddle River, New Jersey 07458
Affymetrix GeneChip experiment • RNA from different types of brain tumors extracted • Extracted RNA hybridized to GeneChips containing approximately 6,800 human genes • Identified gene expression profiles specific to each type of tumor © 2005 Prentice Hall Inc. / A Pearson Education Company / Upper Saddle River, New Jersey 07458
Profiling tumors • Image portrays gene expression profiles showing differences between different tumors • Tumors: MD (medulloblastoma) Mglio (malignant glioma) Rhab (rhabdoid) PNET (primitive neuroectodermal tumor) • Ncer: normal cerebella © 2005 Prentice Hall Inc. / A Pearson Education Company / Upper Saddle River, New Jersey 07458
Cancer diagnosis by microarray • Gene expression differences for medulloblastoma correlated with response to chemotherapy • Those who failed to respond had a different profile from survivors • Can use this approach to determine treatment 60 different samples © 2005 Prentice Hall Inc. / A Pearson Education Company / Upper Saddle River, New Jersey 07458
Analysis of microarray results • Inherent variability: need for repetition • Biological and technical replicates • Analysis algorithms • Based on statistical models • Means of generating hypotheses that need to be tested • real-time PCR • Reverse genetics by knockouts © 2005 Prentice Hall Inc. / A Pearson Education Company / Upper Saddle River, New Jersey 07458
SAGE Ihttp://www.sagenet.org/ • Serial analysis of gene expression • Concept: sequence a small piece of each cDNA in a library • Gives measure of abundance of each RNA species • Method • Cut off “tag” from each cDNA • Ligate tags together into a concatemer • Sequence the concatemer © 2005 Prentice Hall Inc. / A Pearson Education Company / Upper Saddle River, New Jersey 07458
AAAAAAA TTTTTTT AAAAAAA TTTTTTT GTAC TTTTTTT CATG GTAC AAAAAAA TTTTTTT CATG GTAC AAAAAAA SAGE II • Cleave cDNAs with four-base cutter restriction enzyme • Ligate adapters containing site for type- IIs restriction enzyme • Cut 14 base pairs from recognition site © 2005 Prentice Hall Inc. / A Pearson Education Company / Upper Saddle River, New Jersey 07458
CATG GTAC GGTCAC CCAGTG CATG GTAC GGTCAC CCAGTG CATG GTAC GGTCAC CCAGTG CATG GTAC SAGE III • Ligate on adapters with restriction sites • Cut with two restriction enzymes to release 26 base pair tag • Ligate tags together into ~500 base pair concatemer © 2005 Prentice Hall Inc. / A Pearson Education Company / Upper Saddle River, New Jersey 07458
SAGE IV • Sequence the concatemers • Identify tag borders • Size of tag and restriction-enzyme sites • Compare tag sequences to database • Abundance of tag is measure of abundance of that RNA species © 2005 Prentice Hall Inc. / A Pearson Education Company / Upper Saddle River, New Jersey 07458
Schematic of SAGE method: © 2005 Prentice Hall Inc. / A Pearson Education Company / Upper Saddle River, New Jersey 07458
MPSS I (Lynx Therapeutics, Inc) • Massively parallel signature sequencing • Means of determining abundance of RNA species • Unique tags added to cDNAs • Tags hybridized to oligonucleotides on microbeads http://www.lynxgen.com/wt/tert.php3?page_name=mpss © 2005 Prentice Hall Inc. / A Pearson Education Company / Upper Saddle River, New Jersey 07458
MPSS II • Sequencing performed in glass chamber • Initiated by restriction enzyme revealing four-base overhang • Hybridization of four-base adapters used to read sequence • Number of times a particular sequence is found is measure of RNA abundance (costs 25K) Up to 1,000,000 sequencing reactions are done at once © 2005 Prentice Hall Inc. / A Pearson Education Company / Upper Saddle River, New Jersey 07458
Real-time PCR • Sensitive means of measuring RNA abundance • Not genomewide: used to verify microarray results • TaqMan method uses fluorescently tagged primers • Fluorescent tag released by Taq polymerase © 2005 Prentice Hall Inc. / A Pearson Education Company / Upper Saddle River, New Jersey 07458
Real-time PCR readout • The readout of a real-time PCR reaction is a set of curves • The curves indicate the PCR cycle at which fluorescence is detected • Each cycle is twice the amount of the previous cycle © 2005 Prentice Hall Inc. / A Pearson Education Company / Upper Saddle River, New Jersey 07458
Genomic analysis of gene expression • Methods capable of giving a “snapshot” of RNA expression of all genes • Can be used as diagnostic profile • Example: cancer diagnosis • Can show how RNA levels change during development, after exposure to stimulus, during cell cycle, etc. • Provides large amounts of correlation data • Can help us start to understand how whole systems function © 2005 Prentice Hall Inc. / A Pearson Education Company / Upper Saddle River, New Jersey 07458
Summary • Microarrays • Compared with Northern blots • How they are made • How they are used • Differences between spotted and oligonucleotide microarrays • Examples of microarray experiments • SAGE • MPSS • Real-time PCR © 2005 Prentice Hall Inc. / A Pearson Education Company / Upper Saddle River, New Jersey 07458