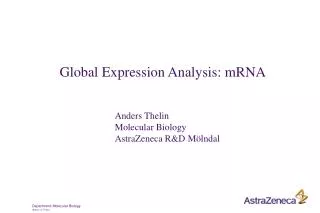
Global Expression Analysis: mRNA
Global Expression Analysis: mRNA. Anders Thelin Molecular Biology Astr aZeneca R&D Mölndal. A cell is defined by its protein content/activities. Her edity and environment affect protein content (gene expression). cell-cell interactio n. hormones. disease. nutrition.

Global Expression Analysis: mRNA
E N D
Presentation Transcript
Global Expression Analysis: mRNA Anders Thelin Molecular Biology AstraZeneca R&D Mölndal
A cell is defined by its protein content/activities • Heredity and environment affect protein content • (gene expression) cell-cell interaction hormones disease nutrition
Traditional Drug Discovery Process Medical need Idea Model Chemicals Lead CD Toxicology Pharmacokinetics Human testing
Black Box Approach Effect Hit Unknown target protein Drug No effect Model Experimental animal Tissue Cells Cell preparation
This approach has, historically, been very successful but, the success of the “black box” approach is dependent on a relevant model. Potential problems……... - hard to find relevant disease model - selected animal model may appear to have the same disease process as humans but does in fact not. - identified lead substances have only effect in animal model may be caused by model protein target is different compared to human - effects of lead substance is unspecific, giving problems toxicology
Molecular Approach Effect Hit Drug No effect Known drug target
A molecular understanding of the disease mechanism would allow….. - selection of optimal target (protein) - design of drugs for specific effect - development of HTS models - development of transgenic model animals
pro- tein N P I R E pro- tein O mRNA T DNA pro- tein pro- tein pro- tein pro- tein The proteins in a cell determine all processes in the cell
pro- tein N P I R E pro- tein O mRNA T DNA pro- tein pro- tein pro- tein pro- tein Disease and disease treatment affect proteins Disease
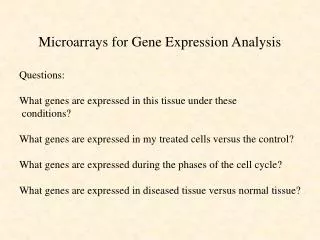
How can gene expression be analyzed? • Functional assay • Proteomics • Genetic profiling • mRNA levels
Global measurement of protein activity Can’t be done But….
Protein amount or mRNA amount can! Correlation between amount and activity? Correlation between change in amount and activity?
Assumptions Understanding gene expression is important for understanding how cells function at the molecular level Diseases and disease treatment affect gene expression
Protein content or change in protein content • mRNA content or change in mRNA content Protein mRNA sensitivity post-translational modifications molecular biology follow-up closer to protein activity Complementing methods
Smallest genome of free living organism codes for <500 genes • (Mycoplasma genitalium) Saccharomyces cerevisiae genome codes for 6500 genes Mammalian genomes codes for 40.000 genes
How many genes are expressed in a mammalian cell? 10.000-20.000 A liver cell contains 106 mRNA molecules About 100 species are abundant with 5.000-50.000 copies/cell Several hundred species have 100-1.000 copies/cell Several thousand species have 0.1-1 copies/cell
What affects gene expression? Development/differentiation Hormones/growth factors Cell-to-cell contact Environment nutrition heat shock toxic substances pathogens injuries/inflammation
Different cells express different genes Expression of genes are regulated Regulation can occur at several levels 1. Transcription 2. mRNA stability 3. Translation 4. Protein stability
Single gene expression • -Northern blot • -Ribonuclease protection assay (RPA) • -Reverse transcriptase polymerase chain reaction (RT-PCR) • Global (multiple) gene expression • -Differential display • -Representational difference analysis (RDA) • -Serial analysis of gene expression (SAGE) • -DNA microchip arrays
RNA Northern blot Probe (radiolabeled antisense cDNA or RNA) Agarose gel Nylon membrane Hybridization Autoradiography
Ribonuclease protection assay RNA sample Add radiolabeled RNA probe Add RNase A and T1 Separate fragments on gel autoradiography
Reverse transcriptase polymerase chain reaction Reverse transcription RNA sample cDNA Reverse transcriptase, primer PCR amplification PCR product cDNA Taq polymerase, specific primer Agarose gel
Real-time reverse transcriptase PCR -Very sensitive -Robust -”Fast”
F Q 5´ 3´ 3´ 5´
1b 2b 3b 4b Differential Display Total RNA (>2 µg) (A) (B) cDNA Anchored primers PCR Random primers 1a 2a 3a 4a 1a 1b 2a 2b 3a 3b 4a 4b
Representational Difference Analysis (RDA) in collaboration with RIT 1 2 totalRNA >50ng cDNA Linker PCR cDNA(1) PCR Amplifies cDNA which are specific for tissue 1
Representational Difference Analysis Tissue 2 Tissue 1 mRNA mRNA cDNA Restriction digest cDNA Restriction digest Add linker In excess mix, melt, anneal Fill in the ends exponential linear PCR amplify cDNA specific for tissue 1 enriched
AAAAAAAA TTTTTTTTT AAAAAAAA TTTTTTTTT AAAAAAAA TTTTTTTTT AAAAAAAA TTTTTTTTT GATC AAAAAAAA TTTTTTTTT GATC AAAAAAAA TTTTTTTTT GATC A B GGATGCATG CCTACGTAC GGATGCATG CCTACGTAC AAAAAAAA TTTTTTTTT AAAAAAAA TTTTTTTTT A B GGATGCATG CCTACGTAC GGATGCATG CCTACGTAC AAAAAAAA TTTTTTTTT AAAAAAAA TTTTTTTTT A B GGATGCATG CCTACGTAC GGATGCATG CCTACGTAC AAAAAAAA TTTTTTTTT AAAAAAAA TTTTTTTTT A B GGATGCATG CCTACGTAC GGATGCATG CCTACGTAC XXXXXXXXX XXXXXXXXX OOOOOOOOO OOOOOOOOO CATG GTAC CATG GTAC CATG GTAC XXXXXXXXX XXXXXXXXX XXXXXXXXX XXXXXXXXX XXXXXXXXX XXXXXXXXX OOOOOOOOO OOOOOOOOO OOOOOOOOO OOOOOOOOO OOOOOOOOO OOOOOOOOO Serial Analysis of Gene Expression Biotinylated anchored primers cDNA synthesis Imobilisation streptavidin beads restriction enzyme digestion Divide in two pools add linker A and B Cut with tagging enzyme Ligate blunt ends Ditag Cut with CATG restriction enzyme Ligate to multi ditag
DNA microarray Poly A mRNA UGAACUGAUAGAUGACGUAG Complementary probe (cDNA, oligonucleotide) ACTTGACTATCTACTGCATC Put probe on chip Surface (nylon, glass) Label – Label – Hybridize labeled total mRNA (radioactivity, fluoresence) Detect label
24µm 24µm 1.28 cm 107-108 identical probes/feature 1.28 cm 270,000 features/chip
Photolithography (Affymetrix) Light (deprotection) Mask TTOOO OOOOO HO HO OOO T – Substrate Light (deprotection) CATAT Mask AGCTG TTCCO TTOOO TTCCG C – Substrate REPEAT
Affymetrix DNA chip mRNA 5’ 3’ PM MM 10-20 pairs PM -25 bases with perfect match to probe sequence MM -25 bases with one base mismatch to probe sequence
Commercial Affymetrix Arrays Human 30.000 genes Mouse 30.000 genes Rat 21.000 genes Yeast 6.100 genes Custom made arrays
Total RNA >15µg T7-poly-T primer Reverse transcriptase Biotin labeled UTP, CTP T7-cDNA T7 RNA polymerase cRNA-*
Hybridize cRNA-* on chip Wash away unbound cRNA Add streptavidin conjugated phycoerythrin Wash again Detect fluoresence using a confocal microscope
Probe Arrays (chips) Fluidics Station Scanner Software
a b, c, d e f
Generate huge amounts of complex data • -Data storage • Expression of many genes will be changed • -Individual variation • -Experimental variation • -Direct, indirect effect • Reduce complexity • -Experimental design • -Mathematical/Statistical analysis • -Bioinformatic analysis
Experimental design • Individual variation • Experimental variation • Paired samples vs. Multiple samples
DNA micro array data can be used • in two types of analysis • Find specific genes • Find gene or samples with similar gene expression patterns
SpotFire Datavisualisation • Remove genes with non-significant signals • Remove genes with fold-change<2 • Remove genes with interindividual variation
Mathematical/Statistical analysis Expression level 18 genes Time
Clustering Expression level Time
Cluster analysis • Find groups of genes with similar expression patterns • or • Find groups of samples with similar gene expression patterns Subgrouping of different types of breast cancer Genes with similar expression patterns after leptin treatment. One cluster contained several genes regu- lated by SREBP-1. Suggest that leptin partly may act via SREBP-1. Soukas et al. In Genes & Development, 14:963-980, (2000) Samples with no histological difference could be grouped into subgroups using expression patterns. These subgroups had different clinical prognosis. Sorli et al. PNAS 98: 10869-10874 (2001)
LowG4 LowG3 LowG5 LowG2 LowG1 HighG3 HighG2 HighG5 HighG4 HighG1 Model validation using cluster analysis Obesity model: high-low gainer. Eating behavour is controlled by hypothalamus. Is differences in eating behavour reflected by differences in hypothalamic gene expression? Analyze gene expression in hypothalamus from five HighG and five LowG. Cluster individuals with similar gene expression patterns using hierchical clustering Geneexpression in hypothalamus reflect eating behaviour. One sample/animal is an outlier.
Bioinformatics An array experiment produce lists of genes which you are mostly unfamiliar with Biology information databases Litterature Experts
Gene Profiling Follow-up Experiments • Expression profiling findings needs to be verified • -New tissues • -Tissue distribution • -New similar conditions • -Better resolution • Establish relation • -Cause-effect • -Temporal-spatial
Future and current development • Smaller samples • Microdissection • Sample amplification


![[VI]. Post-Transcriptional Processing and Post-Transcriptional Control of Gene Expression](https://cdn1.slideserve.com/3214110/vi-post-transcriptional-processing-and-post-transcriptional-control-of-gene-expression-dt.jpg)