Motion Analysis & Reaction Time Problems in Physics
Explore x vs. t graphs, velocity diagrams, and soccer-related time problems in this interactive chapter. Solve scenarios involving distance, time, and reaction time in real-life situations.

Motion Analysis & Reaction Time Problems in Physics
E N D
Presentation Transcript
PHYS 101 Knight et al., chapter 2
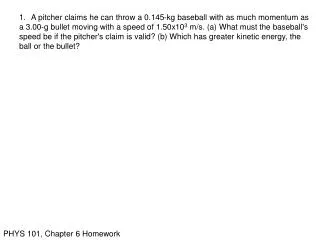
time for the first problem: At t = 0s a soccer forward is 15 m from the goal when he hits the ball towards the goal. At t = 0.5s the ball passes the last defender who is 5m in front of the goal. How much time does the goalie have to react?
OK, here’s another one: Alan leaves Los Angeles at 8:00 AM to drive to San Francisco, 400 mi. away. He travels at a steady 50 mph. Beth leaves Los Angeles at 9:00 AM and drives a steady 60 mph. • who gets to San Francisco first ? • How long does the first to arrive have to wait for the second ?