Download
1 / 45
460 likes | 985 Vues
Benefit Cost Analysis Nathaniel D. Coley Jr. Economic Analysis Program FHWA Office Of Asset Management. Agenda. Economic Analysis and Asset Management Benefit Cost Analysis Federal Activities Guidance Existing Tools. Transportation Economic Analysis(Definition).

E N D
Benefit Cost AnalysisNathaniel D. Coley Jr. Economic Analysis Program FHWA Office Of Asset Management
Agenda • Economic Analysis and Asset Management • Benefit Cost Analysis • Federal Activities • Guidance • Existing Tools
Transportation Economic Analysis(Definition) • “Transportations Economic Analysis is the analysis of the design, construction, preservation, maintenance, and consumption of transportation assets and services and the impact of those activities on direct and indirect users and the environment.” • Nat Coley
Economic Analysis Supports the Vision • We seek to link user expectations and needs for system condition, performance, and availability with system management and investment strategies over an extended time horizon. • We maintain, upgrade, and operate our transportation assets to meet or exceed the needs of our transportation users for the long term.
1 POLICY DRIVEN – decisions reflect policy goals and objectives that define desired system condition and service levels 2 PERFORMANCE BASED – clear measures of performance and target service levels are established 3 OPTIONS EVALUATED – comprehensivechoices and tradeoffs are examined at each level of decision-making 4 DECISIONS BASED ON QUALITY INFORMATION – management systems and tools are used 5 CLEAR ACCOUNTABILITY – performance results are monitored and reported Asset Management Principles
Leveraging BCA to Support Policies Transportation Asset Management Guide:Vol.2 A Focus on Implementation (Chapter 5)
New Transportation Bill • National Surface Transportation Policy and Revenue Study Commission recommends: • “…Federal funding that is performance-based and focused on cost-beneficial outcomes • with accountability for the full range • of economic, environmental, and • social costs and benefits of • investments;”
FHWA Economic Analysis Activities • Code of Federal Regulations Section 650 Various bridge projects require a Benefit Cost Analysis • Section 627 Value Engineering – Projects over $25 million “establish a worth for that function, generate alternatives through the use of creative thinking, and provide the needed functions to accomplish the original purpose of the project, reliably, and at the lowest life-cycle cost without sacrificing safety, necessary quality, and environmental attributes of the project. “
FHWA Economic Analysis Activities • Section 450.320- Identification and evaluation of the anticipated performance and expected benefits of appropriate congestion management strategies that will contribute to the more effective use and improved safety of existing and future transportation systems based on the established performance measures. • Also Section 450 –”all of the reasonable alternatives under consideration must be fully evaluated in terms of their transportation impacts; capital and operating costs; social, economic, and environmental impacts; and technical considerations” The benefit cost analysis model also assists practitioners develop reports required specifically by various National Environmental Policy Act(NEPA) requirements
FHWA Economic Analysis Activities • US Code Title 23 Section §101 –Projects of National and Regional Significance: COMPETITIVE GRANT SELECTION AND CRITERIA FOR GRANTS. • to reduce congestion, including impacts in the State, region, and Nation; • to improve transportation safety, including reducing transportation accidents, injuries, and fatalities • Grants for Transportation Investment Generating Economic Recovery(T.I.G.E.R.) requirements
FHWA Economic Analysis Activities • The Transportation Infrastructure Finance and Innovation Act (TIFIA) • Engineering Economic Analysis Practices for Highway Investment (NCHRP 20-05/Topic 41-03) • FHWA's Office of Operations Technology Services Developing a Benefit-Cost Analysis desk reference to assess investments in management and operations • BCA in Freight
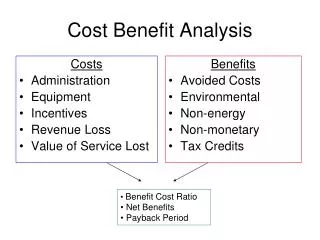
Benefit Cost Analysis • “Benefit Cost Analysis is a calculation of the stream of both benefits and costs over the lifetime of the facility or strategy.” • FHWA Procedural Guidelines for Highway Feasibility Studies
Benefits Initial Capital Costs Cost Dollars 6 1 2 3 4 5 7 8 9 10 11 12 16 18 19 20 15 13 14 17 0 Year Status of Economic Analysis – FHWA Guidance Typical Life-Cycle Profile • Example Indirect Benefits • Land use impacts • Employment • Non-user benefits • Example Direct Benefits • Reduced Accident Costs • Reductions in Delay Costs • Reduced noise or emissions
Calculate Present Values of Costs and Benefits Initial Activity Major Activity $ Activities Costs Time $ Benefits Time What is the present value of future sums?
Define objectives Specify assumptions Identify base case and alternatives Set analysis period Define level of effort Analyze traffic Estimate benefits and costs Evaluate risk Compare net benefits and rank alternatives Make recommendations MethodBCA Process
Recommended BCA Measures Status of Economic Analysis – FHWA Guidance • Net Present Value (NPV) • Benefit-Cost Ratio (BCR) • Other measures include: • Equivalent Uniform Annual Value (EUAV) • Internal Rate of Return (IRR)
User Costs in LCCA • User Costs in the LCCA are differential Costs resulting from periods of construction, preservation, and/or rehabilitation activities between the alternates that generally restrict the capacity of the facility and disrupt normal traffic flow .
User Cost Components • Vehicle Operating Costs(VOC) • Delay Costs • Crash Costs
User Cost Components • Vehicle Operating Costs (VOC) • additional costs incurred by the vehicle for the additional speed changes, stops, miles for detours, hours of idling, etc. that are incurred because of work zone activities • Delay Costs • Value($) of time for each vehicle classification used in the LCCA • Crash Costs • the dollar value of the additional crash types attributed to the work-zone activities.
Calculating User Costs • User costs are • …based on capacity flow analysis. • …a function of workzone impacts for the M&R strategy that you select for maintaining the alternate designs. • …are directly dependent on the volume and operating characteristics of the traffic on the facility.
Risk and Uncertainty Boston Central Artery 1985-2007 $2.5 to $14+ Billion Status of Economic Analysis – FHWA Guidance
Status of Economic Analysis – FHWA Guidance • Probabilistic Analysis • Inputs are defined by their range of values and probability of occurrence (probability distribution) • Through simulation, outputs are expressed as ranges of values with probabilities of occurrence Output Inputs
Most Likely Best Case Worst Case Simulation Results: Histogram Frequency 2.8 2.9 3.0 3.1 3.2 3.3 3.4 Range = 0.4 Net Present Value (NPV), $Millions
90% 50% 10% Results: Cumulative Distribution 1.0 0.8 0.6 Probability 0.4 0.2 0 2.8 2.9 3.0 3.1 3.2 3.3 3.4 Net Present Value (NPV), $Millions
Alternative B Comparing Alternatives Frequency Alternative A 2.8 2.9 3.0 3.1 3.2 3.3 3.4 Net Present Value (NPV), $Millions
84% 64% Comparing Alternatives 1.0 Alternative A 0.8 0.6 Probability Alternative B 0.4 0.2 3.15 0 2.8 2.9 3.0 3.1 3.2 3.3 3.4 Net Present Value (NPV), $Millions
Status of Economic Analysis – FHWA Guidance • FHWA Economic Analysis Primer • Benefit Cost and Life-Cycle Cost Analysis Fundamentals and Steps • Provides guidance, recommended values for discount rates and sources of indexes for inflation, values of user time. • Discusses the consideration of forecasted traffic flows • Provides guidance on BCA in NEPA
Status of Economic Analysis – FHWA Guidance • Grants for Transportation Investment Generating Economic Recovery(T.I.G.E.R.) requirements (See Handout) • Interchange Access Approval Information Guide • FHWA Federal Guidelines for Highway Feasibility Studies: Economic Justifications are based on BCA • Office of Secretary of Transportation(OST) Value of time and value of life guidance • Office of Management and Budget Circular A-94 Guidance on Discount Rates
BCA.net and BCA • AASHTO Red Book • Transit Cooperatice Research Program(TCRP) Report 78 Environmental Impacts • Highway Capacity Manual(HCM) 2000 Developing Traffic inputs
web-based benefit-cost analysis tool develop strategies for improving and managing assets; evaluate & compare the benefits and costs of the alternative strategies; provide summary metrics for investment decisions. Calculates the traffic impacts and the present values of agency and user costs and externalities for the base case & alternative then compares them to arrive at measures including the net present value, benefit-cost ratio, and internal rate of return Economic Analysis Tools: BCA.net
Economic Analysis Tools: BCA.net • Allows for multi-phased, multi-year programs of preservation or improvements enabling a lifecycle comparison of alternate strategies. • Enables the analysis of a range of capacity improvement strategies including lane widening, adding lanes and reversible lanes for roadways with skewed directional flows. • Models traffic conditions for multiple “representative days” to describe forecast facility use. • Evaluates interchange/intersection improvements including the replacement or introduction of traffic control devices and signals. • Accounts for the effects of roadway conditions on trip cost and, in turn, the impact of trip cost changes on travel demand.
Economic Analysis Tools: BCA.net • Has a full-featured risk analysis capability. • Models and calculates the life-cycle impacts on the environment • Project Benefits Calculated by BCA.net include • Time savings – the reduction in travel time by users of the roadway • Vehicle Costs reductions – the reduction in expenditures by users on fuel, oil, tires, vehicle maintenance and depreciation • Safety – the reduction in casualties and property damage from roadway crashes. • Emissions (CO, NOx)
BCA.Net – User Interface Format the data set that we will be analyzing How we plan to meet the objective of the project and specify the effects Define the base case values for traffic stream, input forecasts and assign our available strategies Assign Values inputs such as User costs, Discount Rate, set risk features of input values Specify the Distribution of traffic streams, delay times for interchange/intersection Parameters Specify our sampling routine and simulate the effects of our strategy
Life-Cycle Cost Analysis Definition • Life-Cycle Cost Analysis is a process for evaluating the total economic worth of a usable project segment by analyzing initial costs and discounted future costs, such as maintenance, user, reconstruction, rehabilitation, restoring, and resurfacing costs, over the life of the project segment. • Source: Transportation Equity Act for the 21st Century
LCCA Process • 1. Establish Alternatives • 2. Determine Activity Timing • 3. Estimate Agency & User Costs • 4. Compute Life-Cycle Costs • 5. Analyze the Results
Bridge LCCA Resources • Bridge Life Cycle Cost Analysis(BLCCA) NCHRP Project 12-43 • Bridge Life-Cycle Cost(BLCC) National Institute of Technology(NIST) • PONTIS and FHWA RealCost Software • Webinar in February with example applications
BLCCA - NCHRP • Defines the Bridge Using NBI Data • Has costing models for bridge condition and load capacity • Includes many costs for various bridge items • Performs a sensitivity analysis • Can’t analyze individual elements
BLCC NIST • Performs the LCCA per individual Bridge Components • Can simulate randomness of variables through a probabilistic analysis(Monte Carlo Simulation) • Incorporates detailed costs of workzones • Does not provide detailed models for various costs
BridgeLCC(NIST) • Analyzes preliminary design of highway bridges, roadways, piers, and other civil infrastructure • includes sensitivity analysis, Monte Carlo simulations • Includes FHWA CoRe Element System, user costs, probabilistic events, probabilistic costs, and exportable data and results.
The LCCA Process in RealCost Analyst Function Analyst Function REALCOST FUNCTIONS Inputs (Traffic Data, Cost data,Discount Rate, etc) Model traffic conditions Calculate Costs (User & Agency) Outputs (NPV curves& analysis graphs) EvaluateResultsin theContext ofProject Objectives
Thank You • Nathaniel D. Coley Jr. • Evaluation and Economic Investment Team • FHWA Office of Asset Management • Washington, DCNColey@dot.gov202-366-2171 • http://www.fhwa.dot.gov/infrastructure/asstmgmt/economic.cfm