Download

1 / 68
680 likes | 681 Vues
This study examines the impact of wind farms on birds in Spain, specifically focusing on the Strait of Gibraltar migration point. The study found that bird mortality was low and breeding success was unaffected in wind farms. However, the study also revealed high mortality rates for raptors, particularly griffon vultures. The findings highlight the need for improved risk assessment methods and better placement of wind turbines to mitigate the negative impact on bird populations.

E N D
Birds and Wind Farms The state of the art in Spain 2017 M.Ferrer EBD-CSIC
CLIMATE CHANGE SPEED: 4-5 Km/year ACCORDING JULY ISOTHERMS • BETWEN 10 AND 25 TIMES FASTER • THAN IN THE LAST GLACIATION
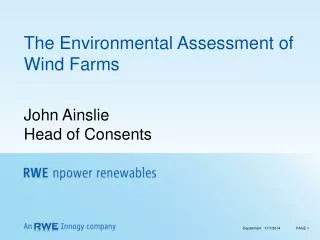
The effects of a wind farm on birds in a migration point: the Strait of Gibraltar Cádiz 1993
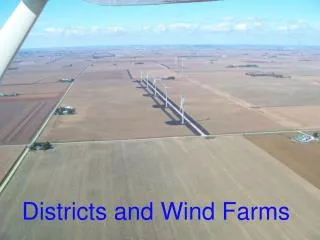
STUDY AREA SPAIN NP WF AM Atlantic Ocean Mediterranean Sea
Birds changed flight direction when crossing wind farm, increasing altitude and avoiding turbines • Passerines diversity, density and breeding success was equal in and out of the wind farm • Bird mortality was low in this wind farm
No differences before-after in both bird and small mammals densities
20 Wind farms, 252 Turbines Power 0.8-2.2 MW, Height (without blades) 50-80 m
High mortality rates with 337 collided birds per year, 124 of them raptors. • With mean collision rate of 1.33 birds per turbine and year being one of the higher mortality records published in the world
Mortality per turbine and year was significant different among wind farms • The one with the highest mortality of griffon vultures was causing 23% of total mortality for the species, followed by another one causing 13%
No relationship between density (number of birds crossing the area) and mortality of birds at the wind farm scale
Univariate Tests of Significance Over-parameterized model Type III decomposition
Observed vs. Expected Frequencies in griffon vultures Chi-Square = 316,3429 df = 251 p < ,003227 Coefficient of variation of vulture mortality: Among wind farms: 50% Among turbines: 150%
But: How were these high impact wind farms authorized? Didn't they conduct risk assessment studies? Did they carry them out in a wrong way?
Risk assessment studies in Spain, as in Europe and several states in USA, rely mainly on bird counts in the potential area for the new wind farm. • Some other aspects are considered such distance to breeding areas of sensitive species, bat breeding or roosting sites and others. • The most relevant factor for raptors is considered to be the local density in the potential area, usually measured as the number of birds crossing the whole area of the future wind farm.
Observation at risk per hour Deaths per turbine and year Wind Risk ___________________________________________________ Farm level Birds Vultures Raptors Birds Vultures Raptors 1 1 14.10 6.00 1.94 1.05 0.78 0.10 2 1 20.03 5.52 2.72 2.38 1.88 0.19 3 0 9.01 4.76 1.33 0.83 0.08 0.04 4 0 12.20 2.09 1.50 0.61 0.12 0.14 5 0 8.75 2.20 1.67 2.11 0.66 0.44 6 1 16.23 2.23 1.92 1.25 0.15 0.22 7 0 17.24 5.91 1.65 1.63 0.00 0.00 8 1 3.18 1.01 0.49 0.53 0.23 0.04 9 0 7.79 1.28 1.74 1.57 0.11 0.25 10 0 8.62 2.19 1.65 1.83 0.50 0.33 11 0 14.69 5.91 1.98 2.00 0.83 0.00 12 1 4.09 0.33 0.73 0.76 0.05 0.11 13 0 6.45 3.02 2.30 1.46 0.20 0.20 14 0 6.45 3.02 2.30 2.20 0.33 0.06 15 0 5.55 1.90 0.84 1.20 0.20 0.06 16 0 7.56 1.04 1.75 1.61 0.22 0.46 17 1 20.03 10.52 2.72 1.45 1.09 0.00 18 0 16.27 8.18 1.18 3.81 0.43 0.00 19 0 16.35 7.93 2.50 1.00 0.00 0.00 20 0 18.67 9.87 1.44 0.60 0.24 0.12
Observation at risk per hour Deaths per turbine and year Wind Risk ___________________________________________________ Farm level Birds Vultures Raptors Birds Vultures Raptors 1 1 14.10 6.00 1.94 1.05 0.78 0.10 2 1 20.03 5.52 2.72 2.38 1.88 0.19 3 0 9.01 4.76 1.33 0.83 0.08 0.04 4 0 12.20 2.09 1.50 0.61 0.12 0.14 5 0 8.75 2.20 1.67 2.11 0.66 0.44 6 1 16.23 2.23 1.92 1.25 0.15 0.22 7 0 17.24 5.91 1.65 1.63 0.00 0.00 8 1 3.18 1.01 0.49 0.53 0.23 0.04 9 0 7.79 1.28 1.74 1.57 0.11 0.25 10 0 8.62 2.19 1.65 1.83 0.50 0.33 11 0 14.69 5.91 1.98 2.00 0.83 0.00 12 1 4.09 0.33 0.73 0.76 0.05 0.11 13 0 6.45 3.02 2.30 1.46 0.20 0.20 14 0 6.45 3.02 2.30 2.20 0.33 0.06 15 0 5.55 1.90 0.84 1.20 0.20 0.06 16 0 7.56 1.04 1.75 1.61 0.22 0.46 17 1 20.03 10.52 2.72 1.45 1.09 0.00 18 0 16.27 8.18 1.18 3.81 0.43 0.00 19 0 16.35 7.93 2.50 1.00 0.00 0.00 20 0 18.67 9.87 1.44 0.60 0.24 0.12
GLM using Poisson distribution and log link function Dependent variable Birds per turbine and year df Wald P Intercept 1 0.007 0.931 Bird / hour 1 0.012 0.909 Birds at risk / hour 1 0.587 0.443 Risk level 1 0.541 0.461 Griffon vultures per turbine and year df Wald P Intercept 1 2.784 0.095 G. vulture / hour 1 0.813 0.366 G. vulture at risk / hour 1 0.204 0.650 Risk level 1 1.819 0.177 Other raptors per turbine and year df Wald P Intercept 1 1.477 0.224 Raptor / hour 1 0.140 0.707 Raptor at risk / hour 1 1.504 0.220 Risk level 1 0.536 0.464
And Now? • We need to mitigate • mortality caused by • badly placed turbines. • 2) We need to change • our methods to evaluate • the potential risk in • new installations
And Now? • We need to mitigate • mortality caused by • badly placed turbines. • 2) We need to change • our methods to evaluate • the potential risk in • new installations