Download
1 / 29
290 likes | 534 Vues
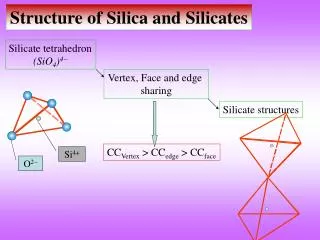
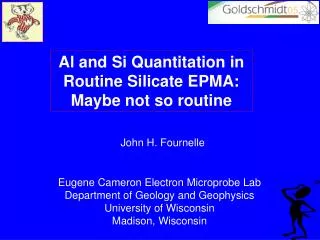
Al and Si Quantitation in Routine Silicate EPMA: Maybe not so routine. John H. Fournelle. Eugene Cameron Electron Microprobe Lab Department of Geology and Geophysics University of Wisconsin Madison, Wisconsin. Motivation.

E N D
Al and Si Quantitation in Routine Silicate EPMA: Maybe not so routine John H. Fournelle Eugene Cameron Electron Microprobe Lab Department of Geology and Geophysics University of Wisconsin Madison, Wisconsin
Motivation You mean your new automatic gizmo can’t match the old manual one, from days of yore? A veteran prober kept prodding me about problems with “low totals” his simple silicate analyses (olivine, pyroxene, garnet).
We narrowed down the problem to issues related to peaks of standards and unknowns: How wide are the peak tops? Are there chemical peak shifts? Is there a problem with our peaking procedure? Ans 1. 5-10 sin theta units 2. Yes 3. Yes
Peak Widths ±1s Consider the Si Ka Peak 5 units = 0.42 eV Precise Peak: 4 minutes of scanning every 1 sin theta unit TAP, 15 kev, 20 nA, 10 sec/channel, Si metal
7 units wide 11 units wide 13 units wide Al Ka Peak Top Width: similar to Si — except some wider at top datum every 2 sin theta units
Conclusion 1 Si and Al Ka Peak Widths on TAP: • Many peaks ~ 5 sin theta units wide • For correctly centered peak position, > 2-3 sin theta unit shift will lose counts, and • For 5-6 units shift, at least 1% error • For 7-8 units shift, at least 2% error • And these errors would be doubled for oxide values (oxygen by stoichometry)
Chemical Peak Shifts Have been recognized since the origins of x-ray spectroscopy in the 1920s, e.g., Cl and S Kb peaks (M shell electons = valence electrons)
Al Ka Chemical Shifts White, McKinstry & Bates, 1959, Advan. X-ray Analysis Al Ka Shift vs coordination relative to Al metal: Feldspar (IV): -0.07; Sillimanite (IV+VI): -0.11; Kyanite (VI): -0.12 Also Day, 1963, Nature; Wardle and Brindley, 1971, American Mineralogist
First attempt 2003… Al Ka Peak Shifts - UW SX51 But not reproducible...
… Al Ka Peak Positions (on TAP) are very sensitive to stage Z position A misfocus of 5 units in Z equals a peak shift of 3-4 sin theta units, not trivial. Well adjusted autofocus critical for multiple automated repeated measurements (overnight)
So once autofocus was fixed and many repeat overnight scans run, we had consistent data for Al …
Al Ka Peak Shifts 7 units or 0.6 eV Al metal TAP sp1
Al metal NaAlSi3O8 KAlSi3O8 82%(NaAlSi3O8) - 18%(CaAl2Si2O8) (Na,K)AlSi3O8 51%(NaAlSi3O8) - 49%(CaAl2Si2O8) BaAl2Si2O8 CaAl2Si2O8 Al Ka — Feldspars Only White and Gibbs, 1969, Am. Min., noted that K-feldspar had the greatest Al Kb peak shift relative to Al metal (and sanidine more than microcline).
Coord 4 6 4 4 6 4 6 6 6 6 6+4 4 4 4 4 Coord 4 4 6 6 6 6 6 4 4 6 6+4 4 4 4 4 Al Ka Peak Shifts Two independent measurements, very similar trends … and not a simple function of Al coordination (e.g., consider the range in feldspars)
Si Kb, Ka Chemical Shifts: Historical White, McKinstry and Roy, 1962, GSA Abstract Measured majorSi Kb shifts in SiO2 relative to Si metal: Stishovite (IV): -0.010 Å; Quartz, cristobalite (VI): -0.015Å ˙though no Si Ka Shift between IV and VI seen Kaufman and Moll, 1966, Advances X-ray Analysis Examined Si Ka1, Ka3, Ka4 and Kb for Si metal and 10 common silicate minerals; found differences between silicates for all K lines but NOT Ka1
1 s Quartz 1 s Si metal Microcline 1 s 1 s Olivine
Translating the above data as Ka shifts for quartz: Spectro1 = 0.5 ±0.1 eV; Spectro4 =0.6±0.1 eV A check Compare Above With: • Si Ka shifts of Quartz by HRXFS (high resolution x-ray fluorescence spectroscopy) • Okura et al (1990 Spectrochimica Acta) a-quartz 0.655 eV • Liu et al (2004 Physical Review B) “SiO2” 0.62 eV Further implication: there is a 0.7 - 0.9 eV shift for microcline Si Ka relative to Si metal
Conclusion 2 Si and Al Ka Peak Shifts: • Al: need pay special attention to which specific minerals are being analyzed, and use appropriate standard for peaking/counting (feldspars especially!) • Si: special attention to K, Na feldspars
How to locate peak center? • Automation • ROM routine • Computer data fit • Semi-automation • (operator assisted) • Manual
My experience For many years I relied upon the ROM peaking built into the system. …but not anymore
Results of Automated Al Ka Peaking Options ROM very reproducible: 10 measurements, s.d. of 1.2, range 32374-8
We now use John Donovan’s Probe for Windows software, which had 4 peak center methods.
Here is a post-scan on Al Ka, showing that the peak center returned by ROM was several units off the true peak center. Operator now has final say over peaking
Results of other post-scans … and off a little ROM was good
Conclusions Accuracy in EPMA of Si and Al in silicate minerals requires attention to one of the first steps in calibration, defining the peak positions, because • There are Si and Al Ka chemical peak shifts between some “common” silicate minerals. • Vertical stage drift can yield peak shifts. • Automated peak search routines should be used with a critical eye.
Electronegativity ----> On the basis for chemical shift in Al and Si Ka Precision of EPMA peak measurements is much less than that possible using XPS and AES, and those fields’ literature provide a basis for understanding the EPMA observations. Streubel et al (1991 J. Electron Spectro & Related Phenom): Data on Si and P chemical shifts using XPS and AES Figure 2 (top) plots relative Pauling Electronegativity vs relative binding energy of L shell (2p) DE(Ka) = DE(1s) - DE(2p) Ka peak shift = Difference (vs Si metal) in K binding energy minus Difference in L binding energy