Download
1 / 25
250 likes | 349 Vues
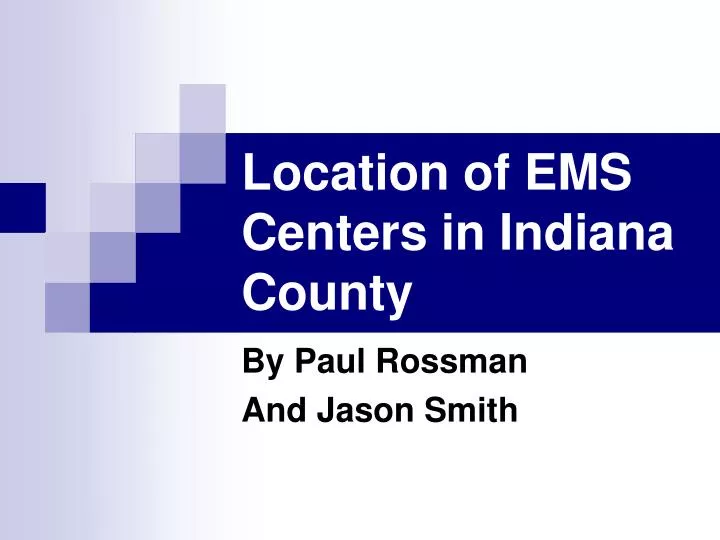
Location of EMS Centers in Indiana County. By Paul Rossman And Jason Smith. Introduction. Optimize placement and minimize the number of EMS (Emergency Medical Service) centers in Indiana County so that the entire population is reached

E N D
Location of EMS Centers in Indiana County By Paul Rossman And Jason Smith
Introduction • Optimize placement and minimize the number of EMS (Emergency Medical Service) centers in Indiana County so that the entire population is reached • EMS Act of 1973: 95% of calls should be reached in 10 minutes
Introduction • Journal of Emergency Medical Services: 2007 survey of the 200 largest U.S. cities stated that 72.78% of EMS agencies use a target of 8:59 minutes or less • Fitch & Associates, 2005: Urban transport ambulance response time benchmarks ranging from 8:59 to 12:59 minutes
Research • Toregas et al., 1971, pioneered binary integer programming and set covering to determine optimal EMS station placement • Eaton et al., 1985, similarly placed ambulance stations
Research • Batta and Mannur, 1990, similarly determined optimal placement of fire stations and ambulance stations • NUMB3RS season 4 opening episode “Trust Metric” (2007): Charlie Eppes uses set covering to optimize the position of police officers in downtown L.A.
Methodology • Downloaded Pennsylvania map from U.S. Census Bureau website • Used ArcGIS to extract map of Indiana County
Methodology • Used ArcGIS to find centers of Indiana County municipalities • Mapped and labeled municipalities in alphabetical order from 1 to 38
Methodology • Imported Indiana County municipality central points into Google Earth • Used Google Earth to find distances in minutes between municipality centers
Populations Inverse proportion = Total Population/ Population of Municipalities
Converting Minutes to Miles Miles = -1.9998789 + 0.56322676 Minutes Sample size: 1444 R (correlation coefficient) = 0.9486 R-sq = 0.8999157
Model • = the set of all municipalities, 1 … 38 • = the distance from node i to node j • T = the maximum predetermined time between municipalities
Model s. t. Z1 = the number of EMS centers required
Technology • Generic Algebraic Modeling System • “a high-level modeling system for mathematical programming and optimization”
Technology option limcol=0; set mun /1*38/; alias (mun,i,j); table travelTime(i,j) "travel time between municipalities in Indiana County" 1 2 3 4 5 6 7 8 9 10 11 12 13 14 15 16 17 18 19 20 21 22 23 24 25 26 27 28 29 30 31 32 33 34 35 36 37 38 1 0.00 42.00 84.00 26.00 20.00 12.00 13.00 11.00 73.00 29.00 35.00 53.00 42.00 38.00 47.00 59.00 5.00 43.00 71.00 68.00 55.00 25.00 32.00 52.00 68.00 63.00 30.00 37.00 48.00 40.00 42.00 71.00 59.00 52.00 75.00 14.00 32.00 47.00 2 42.00 0.00 73.00 34.00 37.00 28.00 37.00 32.00 58.00 21.00 27.00 56.00 34.00 35.00 20.00 44.00 45.00 25.00 73.00 54.00 51.00 20.00 21.00 37.00 61.00 48.00 36.00 17.00 33.00 48.00 10.00 47.00 39.00 24.00 51.00 46.00 21.00 20.00 3 84.00 73.00 0.00 82.00 84.00 76.00 80.00 79.00 18.00 69.00 61.00 34.00 55.00 93.00 62.00 40.00 87.00 61.00 22.00 33.00 47.00 68.00 60.00 41.00 26.00 31.00 67.00 63.00 51.00 104.00 74.00 46.00 51.00 62.00 44.00 94.00 60.00 89.00
Technology set cover(i,j) "Center at municipality i covers municipality j"; cover(i,j) = yes$(travelTime(i,j) <= 8.9333); parameter popWeight(mun) population weight /1 684.0076336 2 28.99838188 3 89.87462387 • 68.03720577 ... Binary Variables buildStation(mun); Variables totalStations; Equations coverConstraint(mun), objective; objective.. totalStations =e= sum(mun, buildStation(mun)*popWeight(mun)); coverConstraint(mun).. sum(j$cover(j,mun),buildStation(j)) =g= 1; model indiana /all/; * any optimum within <1 of the true optimum must BE the true optimum! indiana.optca = 0.999; solve indiana using rmip minimizing totalStations;
Analysis • Fitch & Associates, 2005: Urban transport ambulance response time benchmarks ranging from 8:59 to 12:59 minutes • Using Uniform distribution, we picked 28 random numbers between 8:59 and 12:59 • Similarly, we picked 28 random numbers between 3.01 and 5.31
Solutions * Changes were at 9 minutes, 10 minutes and 12 minutes
Solutions * Changes are at 3.8 and at 4.0
Actual Placement of Centers • According to model, it means a 23-minute response time. • Much lower because of IRPs and other factors
Conclusions • Model is sufficient, however leaves room for opportunities for improvement • Provides a snapshot of needs and thresholds for building EMS centers