IME634: Management Decision Analysis
370 likes | 382 Vues
IME634: Management Decision Analysis. Raghu Nandan Sengupta Industrial & Management Department Indian Institute of Technology Kanpur. Loss Functions.

IME634: Management Decision Analysis
E N D
Presentation Transcript
IME634: Management Decision Analysis Raghu Nandan Sengupta Industrial & Management Department Indian Institute of Technology Kanpur RNSengupta,IME Dept.,IIT Kanpur,INDIA
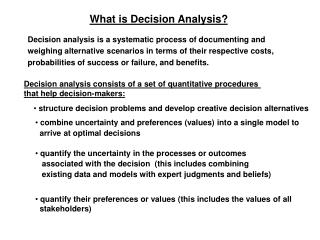
Loss Functions • In the course of a statistical estimation problem, observations (collectively, the sample) pertaining to a data set are regarded as realizations of a random element (X) with which is associated a probability law P • Usually, P is specified by the cumulative distribution function (d.f.) of X, namely, F(x) = P(X x), xR=(-, ) • Generally, F is not completely known, and we are usually interested in drawing statistical conclusion about the parameters, = (F) which are functionals of the d.f. F RNSengupta,IME Dept.,IIT Kanpur,INDIA
Loss Functions • In a parametric model, the assumed functional form of F may involve some unknown algebraic constant(s), which are interpreted as the parameters, e.g., in the normal d.f., the algebraic constants are themselves the mean () and the variance (2) • The objective in point estimation is to utilize the information in the given set (X1,….., Xn) of sample observations (random variables) to choose a suitable statistic Tn = T(X1, X2,..…, Xn) such that Tn estimates (parameter) in a meaningful way RNSengupta,IME Dept.,IIT Kanpur,INDIA
Loss Functions • Imposing consistency and unbiasedness does not always lead to a unique estimator of • A good idea is to locate an optimal estimator within the class of consistent (and possibly, unbiased) estimators • One idea is to choose a nonnegative metric L(Tn , ) defined for all , where varies over (the parameter space) while Tn varies over (the sample space, which is usually a subset of Rn, the n-dimensional Euclidean space) RNSengupta,IME Dept.,IIT Kanpur,INDIA
Loss Functions (SEL) RNSengupta,IME Dept.,IIT Kanpur,INDIA
Loss Functions (Mod Loss Function) RNSengupta,IME Dept.,IIT Kanpur,INDIA
Loss Functions (Asymmentric Linear Loss Function) RNSengupta,IME Dept.,IIT Kanpur,INDIA
Loss Functions (Asymmentric Linear Loss Function) RNSengupta,IME Dept.,IIT Kanpur,INDIA
Loss Functions (LINearEXPonential Loss Function) (Varian, Zellner) RNSengupta,IME Dept.,IIT Kanpur,INDIA
Loss Functions (LINearEXPonential Loss Function) (Varian, Zellner) RNSengupta,IME Dept.,IIT Kanpur,INDIA
LINearEXponential Loss Function (Example # 01) Consider a company plans to launch a new product, say a refrigerator in the consumer market. Also suppose that similar products from different manufacturers already exist in the market. Then the company is expected to give some warranty for the particular product, i.e., the refrigerator, to its customers in order to sell the product. Now if the value of this warranty is more than the average time of failure for the product, then the aforesaid mentioned company needs to replace the damaged products it sells, or face litigation charges. On the other if the warranty period is less than the average failure time of similar products available in the market, then the company losses the market share to its rivals, as naturally, customers are willing to buy the refrigerator from the competitors who assure a higher warranty period. Under such a situation it is definitely advisable to estimate the warranty life time using an asymmetric loss. What values of a one should use would then depend on the level of importance our company places on overestimation versus underestimation, i.e., the cost of litigation versus the cost of a loss in the market share of the company RNSengupta,IME Dept.,IIT Kanpur,INDIA
LINearEXponential Loss Function (Example # 02) As a second example, assume a civil engineer is building a dam and he/she is interested in finding the height of the dam which is being built. If due to some error the height is estimated to be greater than the actual value then the cost the engineer incurs are mainly due to material and labour. On the other hand, if the estimated height is less than what it should be, then the consequences can be disastrous in terms of an environmental impact, which in monetary terms can be very high. So it is logical to use a value of a < 0 in such situations such that underestimation is penalized more than over estimation RNSengupta,IME Dept.,IIT Kanpur,INDIA
LINearEXponential Loss Function (Example # 03) Finally to illustrate the significance of over estimation when compared with underestimation let us consider a different real life example. Consider an electrical company manufactures vacuum circuit breakers/interrupters, which are used as a fuse in high voltage system. As for any product these circuit breakers have a working life and it is of utmost importance that this value is estimated as accurately as possible. In case they are underestimated than what its value is in reality, then the consequences is just labour and man hour loss in terms of production stoppage time. On the other hand if the working life of the circuit breaker is over estimated than the actual figure, then it would definitely signify an exponential form of loss in monetary terms due to an accident or major break down of machineries. So, for these categories of practical estimation problems we always consider a > 0 RNSengupta,IME Dept.,IIT Kanpur,INDIA
Balanced Loss Function (BLF) A balanced loss function (BLF) is of the form, with w having a given value such that 0 w 1. The BLF, (Zellner (1994)), reflects both goodness of fit (lack of bias) and precision of estimation Note: The first term represents the goodness of fit while the second represents the precision of estimation, which is also, termed as accuracy RNSengupta,IME Dept.,IIT Kanpur,INDIA
Data Envelopment Analysis (DEA) • Consider you have a system or also called a decision making unit (DMU), which takes some inputs (I/Ps), processes them and produces some outputs (O/Ps) • Examples of systems or DMUs can be a machine, a factory, a hospital, an airport, an university, etc. RNSengupta,IME Dept.,IIT Kanpur,INDIA
Data Envelopment Analysis (DEA) (contd..) • Invariably there may be many such similar systems or DMUs which take as inputs the same types or set of I/Ps in different quantum, process them and produces the O/Ps, also in different quantum • In such cases we are required to find, what is the rate of processing of the I/Ps or O/Ps, or what is the efficiency of the systems, so that we can compare them amongst themselves and also find out, to what degree they are deficient when compared to the so called ideal system or a fully efficient system or an efficient DMU RNSengupta,IME Dept.,IIT Kanpur,INDIA
Data Envelopment Analysis (DEA) (contd..) RNSengupta,IME Dept.,IIT Kanpur,INDIA
Data Envelopment Analysis (DEA) (contd..) • Let us also consider three (3) different concepts of production and returns, which are • Increasing return to scale (IRTS) • Decreasing return to scale (DRTS) • Constant return to scale (CRTS) RNSengupta,IME Dept.,IIT Kanpur,INDIA
Decreasing Return to Scale (DRTS) RNSengupta,IME Dept.,IIT Kanpur,INDIA
Decreasing Return to Scale (DRTS) (contd..) RNSengupta,IME Dept.,IIT Kanpur,INDIA
Increasing Return to Scale (IRTS) RNSengupta,IME Dept.,IIT Kanpur,INDIA
Increasing Return to Scale (IRTS) (contd..) RNSengupta,IME Dept.,IIT Kanpur,INDIA
Constant Return to Scale (CRTS) RNSengupta,IME Dept.,IIT Kanpur,INDIA
Variable Return to Scale (VRTS) RNSengupta,IME Dept.,IIT Kanpur,INDIA
O/P Oriented Optimization Models (for K DMUs) RNSengupta,IME Dept.,IIT Kanpur,INDIA
O/P Oriented Optimization Models (for K DMUs) (contd..) RNSengupta,IME Dept.,IIT Kanpur,INDIA
I/P Oriented Optimization Models (for K DMUs) RNSengupta,IME Dept.,IIT Kanpur,INDIA
I/P Oriented Optimization Models (for K DMUs) (contd..) RNSengupta,IME Dept.,IIT Kanpur,INDIA
I/P & O/P Oriented Optimization Model RNSengupta,IME Dept.,IIT Kanpur,INDIA
Data Envelopment Analysis (DEA) (contd..) RNSengupta,IME Dept.,IIT Kanpur,INDIA
Data Envelopment Analysis (DEA) (contd..) RNSengupta,IME Dept.,IIT Kanpur,INDIA
DADM-II Lecture TBD (TBD) RNSengupta,IME Dept.,IIT Kanpur,INDIA
Decisions and Utility Analysis(Concepts) Stochastic Dominance • First-order stochastic dominance • Second-order stochastic dominance • Third-order stochastic dominance RNSengupta,IME Dept.,IIT Kanpur,INDIA
Decisions and Utility Analysis(Concepts) First-order stochastic dominance • A lottery F dominates G then the decision maker prefers F to G regardless of what U(W) is, as long as it is • Weakly increasing (i.e., U(Wi) U(Wj), where Wi Wj) RNSengupta,IME Dept.,IIT Kanpur,INDIA
Decisions and Utility Analysis(Concepts) First-order stochastic dominance • F dominates G iff • Simply stated it means that every individual with increasing utility function prefers FW to GW regardless of his/her risk preferences. RNSengupta,IME Dept.,IIT Kanpur,INDIA
Decisions and Utility Analysis(Concepts) First-order stochastic dominance • F dominates G iff FW(W)GW(W) • This definition requires that FW gives more wealth than GW realization by realization. RNSengupta,IME Dept.,IIT Kanpur,INDIA
Decisions and Utility Analysis(Concepts) Second-order stochastic dominance • A lottery F dominates G if the decision maker prefers F to G as long as he/she is • Risk averse • U(W) is weakly increasing (i.e., U(Wi) U(Wj), where Wi Wj) RNSengupta,IME Dept.,IIT Kanpur,INDIA