Download
1 / 21
210 likes | 232 Vues
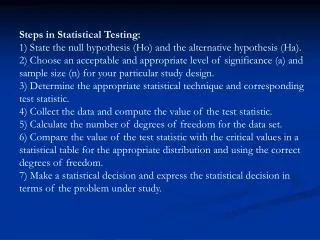
THE CONCEPT OF STATISTICAL SIGNIFICANCE: CHI-SQUARE AND THE NULL HYPOTHESIS. READINGS. Pollock, Essentials , ch. 5 and ch. 6, pp. 121-135 Pollock, SPSS Companion , ch. 7. OUTLINE. Strategies for Sampling Establishing Confidence Intervals Chi-Square and the Null Hypothesis

E N D
THE CONCEPT OF STATISTICAL SIGNIFICANCE: CHI-SQUARE AND THE NULL HYPOTHESIS
READINGS • Pollock, Essentials, ch. 5 and ch. 6, pp. 121-135 • Pollock, SPSS Companion, ch. 7
OUTLINE • Strategies for Sampling • Establishing Confidence Intervals • Chi-Square and the Null Hypothesis • Critical Values of Chi-Square
Why Sample? • Goal: description of a population • Advantages: savings of time and money • Basic paradox: credibility of results from a sample • depends on size and quality of the sample itself, • and not on the size of the population
Types of Samples Probability sampling: Every individual in the population has a known probability of being included in the sample Random sample (SRS): each individual has an equal chance of being selected, and all combinations are equally possible Systematic sample: every kth individual—more or less equivalent to SRS if first selection is made through random process Stratified sample: individuals separated into categories, and independent (SRS) samples selected within the categories Cluster sample: population divided into clusters, and random sample (SRS) then drawn of the clusters
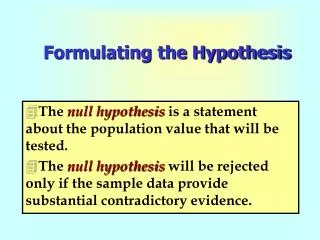
Parameters and Statistics • A parameter is a number that describes the population. It is • a fixed number, though we do not know its value. • A statistic is a number that describes a sample. We use • statistics to estimate unknown parameters. • A goal of statistics: To estimate the probability that the • null hypothesis holds true for the population. Forms: • Parameter may not fall within a confidence band that can be placed around a sample statistic, or • A relationship observed within a sample may not have a satisfactory probability of existing within the population.
Problems with Sampling (I) • Bias: • A consistent, repeated deviation of the sample statistic • from the population parameter • Convenience sampling • Voluntary response sampling • Solution: Use SRS • Variation: • Signal: large standard deviation within sample • Range of sample statistics • Solution: Use larger N
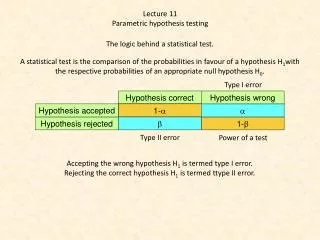
Problems in Sampling (II) Ho for Sample Accepted Rejected Ho for Population True Type I False Type II Where Ho = null hypothesis
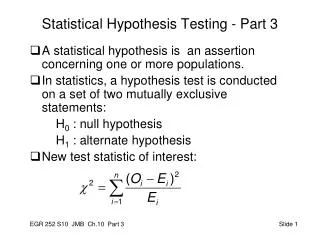
What is Chi-square? A measure of “significance” for cross-tabular relationships Where fo = “observed frequency” (or cell count) And fe = “expected frequency” (or cell count) X2= Σ (fo – fe)2/fe
Calculating Expected Frequencies: fe = col Σ (row Σ/total N) for upper left-hand cell = 802 (200/1,679) = 95.5 fo = 44 fo – fe = 44 – 95.5 = -51.5 (fo – fe)2 = 2,652.25 (fo – fe)2/fe = 27.77
Conceptualizing Chi-Square • Expected frequencies represent the “null hypothesis” (no relationship) • Observed frequencies present visible results • Question 1: Are observed frequencies different from expected frequencies? • Question 2: Are they sufficiently different to allow us to reject the possibility that the true relationship (within the universe of case) is null?
Figuring Degrees of Freedom: df = (r – 1)(c – 1) Illustration: Given marginal values, ________X________ __Y__ L H Σ L 30 50 H 50 Σ 60 40 100 and df = 1
Characteristics of Chi-Square • Distribution for null hypothesis has a known distribution—skewed to the right • Specific distributions have corresponding degrees of freedom, defined as (r-1)(c-1) • For a 2x2 table, chi-square of 3.841 or greater would occur no more than 5% of the time in event of null hypothesis (thus, “.05 level or better”)
POSTSCRIPT • X2 = f (strength of relationship, sample size) • The stronger the observed relationship within the sample, the higher the X2 • The larger the sample (SRS), the higher the X2 • The higher the X2(given degrees of freedom), the greater the probability that null hypothesis does not hold in the population (p < .05)
Limitations of Chi-Square • No more than 20% of expected frequencies less than 5 and all individual expected frequencies are 1 or greater • Directly proportional to N observations • Rejection of null hypothesis does not directly confirm strength or direction of relationship
Review: Summary Measures for Cross-Tabulations • Lambda-b PRE, ranges from zero to unity; measures strength only • GammaForm and strength (-1 to +1), based on “pairs” of observations • Chi-squareSignificance, based on deviation from “null hypothesis”