
Uploaded by
egan
1 SLIDES
240 VUES
20LIKES
Understanding Minority Representation in Local Areas: A Quantitative Analysis
DESCRIPTION
This study analyzes the representation of ethnic minority groups in local areas of Hong Kong using Location Quotient (LQ) metrics. By comparing the number of people in minority groups to the total population, we aim to highlight disparities and provide insights into demographic dynamics. The findings will inform policymakers and community leaders about the inclusivity of local populations and guide efforts toward integration and support for minority communities.
Download
1 / 1
Download Presentation

Télécharger la présentation
Understanding Minority Representation in Local Areas: A Quantitative Analysis
An Image/Link below is provided (as is) to download presentation
Download Policy: Content on the Website is provided to you AS IS for your information and personal use and may not be sold / licensed / shared on other websites without getting consent from its author.
Content is provided to you AS IS for your information and personal use only.
Download presentation by click this link.
While downloading, if for some reason you are not able to download a presentation, the publisher may have deleted the file from their server.
During download, if you can't get a presentation, the file might be deleted by the publisher.
E N D
Presentation Transcript
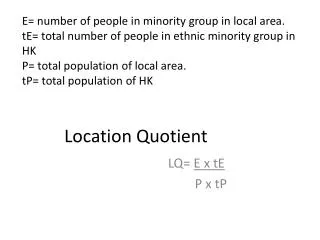
E= number of people in minority group in local area. tE= total number of people in ethnic minority group in HK P= total population of local area. tP= total population of HK Location Quotient LQ= E x tE P x tP


More Related
Audio
Live Player