Download

1 / 18
180 likes | 190 Vues
This study presents a Bayesian survival approach to analyze the risk of recurrent rail defects. The methodology framework includes data collection, pre-processing, and modeling. The results highlight factors that increase or decrease the risk of defect recurrences.

E N D
A Bayesian Survival Approach to Analyzing the Risk of Recurrent Rail Defects Faeze Ghofrani, Reza Mohammadi, Qing He, Abhishek Pathak, AmjadAref INFORMS 2018 Phoenix, Arizona November 6th, 2018
Contents Introduction Background Contributions of the study Methodology framework Results Findings Conclusion
Background • Rail defects (and more specifically broken rails) account for the largest portion of total train derailments causes • Many of rail defects occur in the same location multiple times due to the characteristics of the location. • Analysis of recurrent rail defects can assist in identifying network hotspots and providing on-time responsive maintenance. Number of freight train derailments by accident cause on Class I main lines (Liu et al. 2012). Frequency and severity graph for causes of Class I main-line freight train derailments, 2001–2010 (Liu et al. 2012).
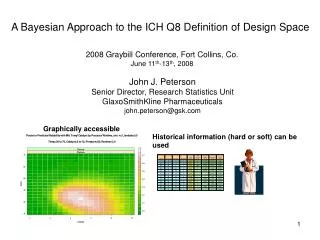
Contributions of the Study • Designing a comprehensive logical methodology framework for data collection, pre-processing, and modeling based on a collection of datasets from different resources in a Class I railroad • Applying the correlated event times of survival analysis in the context of railway transportation for recurrent rail defects • Developing a Bayesian framework by • performing Markov Chain Monte • Carlo (MCMC) simulation for • optimizing the parameters of • the model • Verifying the fit of the model by • using Cox-Snell residual plot
Type of Data Sources -Curve -Grade -Rail laid -Rail Defects -Geometry Defects -Inspection -Rail Patch -Tonnage -Speed Traffic Defects Inputs Maintenance Infrastructure Data Sources The methodology framework • Cleaning each dataset • Creating rail segments of 0.01 mile • Creating time intervals based on tonnage • Aggregating rail defects of same type • Linking data sources according to location and date • Providing new factors based on the existing factors • Attribute or record elimination Processing • Descriptive Statistical Analysis • Developing Bayesian hazard-based duration models Modeling Capital Planning and Responsive Maintenance Planning Decision-Making
A B Segment Samples Censoring Defect occurrence Data Pre-processing C • Dividing the network into short sections (0.01 mile) • Creating tonnage intervals for each segment • Creating new variables for each interval • Linking all datasets based on spatial units with rail defect dataset • Record elimination Tonnage (MGT) 2 6 8 4
Descriptive Statistical Analysis Segments with one, two and more than two recurrent defects Type of defects
Correlated event times Rail segments might have different features, varied experiences, material traits, etc. the risk for a rail defect is a function of the occurrence of previous defects Shared Frailty Model
Shared Frailty Model Specification Baseline hazard function : Weibulldistribution with parameter μand γ hazard function survival function density function for Weibull distribution Likelihoods for Proportional Hazard (PH) model under the frailty approach : shared frailty variable with normal prior (z1,…, zm~N(0, τ2)) and density function: ; -∞<Z<∞ , τ>0 Prior Specification , β~N(0,m), Posterior Calculation and parameter configuration MCMC calculations have been implemented with burn-in period of 5,000 iterations and the Markov chain subsample to get a final chain size of 4,000 iterations
Results Posterior Inference of Regression Coefficients and frailty variance There is a positive relationship between the occurrence of the defects on the same rail segment;
Trace plots for the regression coefficients and frailty variance Iterations Iterations Iterations Iterations Iterations • The parameters have sufficient state changes as the MCMC algorithm runs • This implies that priori distribution is well calibrated Iterations
Density plots for posterior distribution of the regression coefficients and frailty variance • The estimates of the posterior marginal distribution for the coefficients have smooth and unimodal shapes
Model Diagnostics Estimated cumulative hazard function versus the Cox and Snell residual Cox Snell Plot for the fitted model Residuals from a correctly fitted model follow unit exponential distribution
Findings The following factors increase the risk interval for defect recurrences (decrease the hazard): Weight of rail Location of defect (if low side of the curve or tangent) compared to high side of the curve The following factors decrease the risk interval for defect recurrences (increase the hazard): Number of geo defects in the last three years Freight train speed limit “TDD, TW and VSH” types of defect compared to “SD”
Conclusions • Data collection from a Class I railroad • Cleaning, fusion, pre-processing and restructuring of multiple datasets • Study of models for recurrent survival analysis • Provide a model for predicting the tonnage until the re-occurance of a rail defect • According to findings railroad could record the data on lighter segments of rail as well as on the high side of the curves on rail segments to be more certain on the risk of defect recurrence. • The impact of past geometry defects can be reduced by minimizing their occurrence either by accurately predicting the defects or by decreasing the inspection intervals • The impact of the speed can be reduced by decreasing the speed limit on certain segments. • The rail segments with higher risk of frequent rail defects shall be treated more frequently.
Thank you! faezegho@buffalo.edu
References Cook, R. J., & Lawless, J. (2007). The statistical analysis of recurrent events. Springer Science & Business Media. Schafer, D. H., & Barkan, C. P. L. (2008). A Prediction Model for Broken Rails and an Analysis of their Economic Impact. Proceedings of the American Railway Engineering and Maintenance-of-Way Association Annual Conference, 252(847). Chattopadhyay, G., & Kumar, S. (2009). Parameter estimation for rail degradation model. International Journal of PerformabilityEngineering, 5(2), 119–130. Zarembski, A. M., Einbinder, D., & Attoh-Okine, N. (2016). Using multiple adaptive regression to address the impact of track geometry on development of rail defects. Construction and Building Materials, 127, 546–555. Sadeghi, J., & Askarinejad, H. (2010). Development of improved railway track degradation models. Structure and Infrastructure Engineering, 6(6), 675–688. Box‐Steffensmeier, J. M., & De Boef, S. (2006). Repeated events survival models: the conditional frailty model. Statistics in medicine, 25(20), 3518-3533.