Financial Ratio Analysis for Business Profitability Evaluation
Learn to calculate and interpret key financial ratios, such as ROCE and gearing, to assess profitability, efficiency, and liquidity. Explore formulas and classification of ratios for effective financial analysis.

Financial Ratio Analysis for Business Profitability Evaluation
E N D
Presentation Transcript
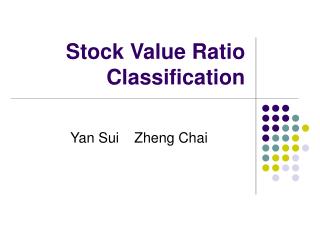
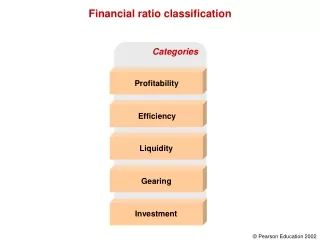
Categories Profitability Efficiency Liquidity Gearing Investment Financial ratio classification
Identify users and their information needs Interpret and evaluate the results Select and calculate appropriate ratios The key steps of financial ratio analysis
Return on ordinary shareholders’ funds Formula Net profit after taxation and preference dividend (if any) x 100Ordinary share capital + Reserves Return on capital employed Net profit before interest and taxation x 100 Share capital + Reserves + Long-term loans Net profit margin Net profit before interest and taxation x 100 Sales Gross profit margin Gross profit x 100 Sales Sales Profitability ratios
Formula Average stock turnover period Average stock held x 365Cost of sales Average settlement period for debtors Trade debtors x 365Credit sales Average settlement period for creditors Trade creditors x 365Credit purchases Sales to capital employed _______ Sales__________ Long-term capital employed _______Sales_______ Number of employees Sales per employee Efficiency ratios
Net profit before interest and taxation sales multiplied by Sales______ Long-term capital employed equals Return on capital employed The main elements comprising the ROCE ratio
Formula Current assets_______________Current liabilities (creditors due within one year) Current ratio Current assets (excluding stock) Current liabilities Acid test ratio Operating cash flows to maturing obligations Operating cash flows Current liabilities Liquidity ratios
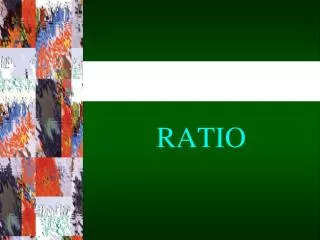
Average current ratio and average acid test ratio for UK listed companies in various industrial sectorsSource: Datastream data, February 2001 Current ratio Acid test ratio 1.6 2.0 1.4 1.8 1.2 1.0 0.8 0.6 0.4 0.2 0.0 Household goods and textiles Information Technology Hardware Food producers Food and drugs retailers Chemicals Electricity Water
Formula Long-term liabilities _______ Share capital + Reserves + Long-term liabilities Gearing ratio Interest cover ratio Profit before interest and taxation_ Interest payable Gearing ratios
Formula Dividends announced during the period Number of shares in issue Dividend per share Dividends announced for the year x 100Earnings for the year available for dividends Dividend payout ratio Dividend per share/(1-t) x 100Market value per share Dividend yield ratio Earnings available to ordinary shareholders Number of ordinary shares in issue Earnings per share Operating cash flow per share Operating cash flows – preference dividends Number of ordinary shares in issue Price/earnings ratio (P/E) Market value per share Earnings per share Investment ratios
6.62 4.19 5.82 6 5.35 5 3.79 3.77 4 2.85 2.84 3 2.53 2.22 1.95 2 1.54 Food and drug retailers Restaurants and pubs Water Electricity Banks Engineering and machinery Construction and building materials Pharma-ceuticals 1 Oil and gas Chemicals Tobacco Distribution 0 Average dividend yield ratios Source: Constructed from information in Financial Times, 8 December 2000
41.50 40 35 26.84 30 22.51 25 17.93 16.83 20 13.91 13.38 12.11 11.60 15 10.21 9.89 8.53 10 Restaurantsand pubs Electricity Banks Construction and building materials Engineeringand machinery Food anddrug retailers Pharmaceuticals Oil and gas 5 Chemicals Tobacco Distribution Water 0 Average P/E ratios Source: Constructed from information in Financial Times, 8 December 2000
Current ratio XYZ Ltd Industry average 1998 1999 1997 2000 2001 Time Graph plotting current ratio against time
Failed firms Non-failed firms Cash flow Total debt Net income Total assets Total debt Total assets 0.79 +0.1 +0.45 0.78 +0.35 0.0 0.65 +0.25 0.58 +0.15 0.51 -0.1 +0.05 0.44 -0.05 0.37 -0.2 -0.15 3 3 4 4 5 5 2 2 1 3 4 5 1 1 2 Mean ratios of failed and non-failed businesses
Failed firms Non-failed firms Working capital Total assets Current ratio No credit interval +0.15 3.5 0.42 0.36 3.0 +0.05 0.30 0.24 -0.05 2.5 0.18 0.12 -0.15 2.0 0.06 3 3 4 4 5 5 2 2 1 3 4 5 1 1 2 Mean ratios of failed and non-failed businesses
Failed businesses Non-failed businesses Current ratio ROCE ratio Scatter diagram showing the distribution of failed and non-failed businesses