Stock Value Ratio Classification
This study examines the Market to Book Value Ratio (MKV/BKV) as a key indicator of investor confidence in companies. By predicting this ratio, we can gain insights into potential stock price movements. Using data from Dow 30 companies, we analyze attributes from COMPUSTAT and clean to select the most relevant features. Our approach involves estimating annual market prices and classifying the ratios into distinct classes. Initial results indicate promising accuracy on training data, with ongoing efforts to enhance feature selection and predictive power.

Stock Value Ratio Classification
E N D
Presentation Transcript
Stock Value Ratio Classification Yan Sui Zheng Chai
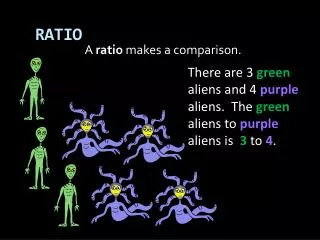
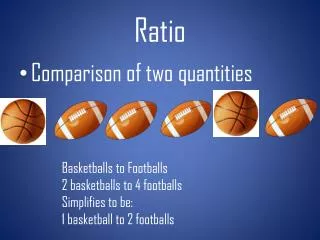
Classification • MKV/BKV is an indicator of investors’ confidence in a particular company • Being able to predict this ratio gives insight to predicting the stock prices
Outline • Define Problem • Data • Method • Initial Result • Discussion
Definition • Market Value • The current quoted price at which investors buy or sell a share of common stock or a bond at a given time. Also known as "market price". • Book Value • The accounting value of a firm. • The total value of the company's assets that shareholders would theoretically receive if a company were liquidated. • Per share: total value divided by number of shares
Problem Definition • Given training data, predict the ratio for the future • Classification vs Prediction Problem • Need to define the classes (more later)
Problem Definition Why do we can about the ratio? • Book value stays relatively constant and could be estimated • Could estimate market price if we know this ratio and estimated book value
Outline • Define Problem • Data • Method • Initial Result • Discussion
Data • Dow Jones Industrial Average (Dow 30) • Consists of 30 of the largest and most widely held public companies in the United States. • E.g. American Express, AT&T, Boeing, Citigroup, Exxon Mobil, GM, GE, Intel, etc.
Data • wrds from Wharton • Attributes are from CRSP/COMPUSTAT Merged database • Book value and market value are from COMPUSTAT North America database • High, low, and closing prices for each month are available
Problem… • Book value is updated annually • 1 per year • Market value is updated daily • 365 per year • What can we do?
Our Approach • Estimate “annual market price” of a stock by averaging its high, low and closing prices over 12 months. • Market value = estimated market price • Another possibility: • Interpolate annual book values
Data Preprocessing • Data Cleaning ~400 attributes --> 68 attributes (possibly more) • Estimate annual market value • Divide the MKV/BKV ratios into a number of classes • Currently, there are 5 classes
Outline • Define Problem • Data • Method • Initial Result • Discussion
Attributes • Hundreds or even thousands possible attributes • Using too many attributes may result in over-fitting • Want to select a subset that work best for the task
Attribute Selection • Select a subset of attributes to use • Algorithms considered • Greedy Algorithm • Genetic Algorithm (genoud package in R)
Evaluation Function • Produce a score of how a particular subset of features work (error rate) • Minimization problem • Possible candidates • SVM • Neural Network • Etc.
Outline • Define Problem • Data • Method • Initial Result • Discussion
Classify on the training data using 10 features Error = abs(predicted - actual)
Explanation of Result • Works well on training set • When applied on new data, accuracy is around 40-50%
To Do List • Retain more (non-atomic) attributes • Try other evaluation functions • Classification on daily ratio • Other feature selection algorithms? • Hopefully, find out which features are more influential in predicting market price for some stocks