Download
1 / 10
100 likes | 296 Vues
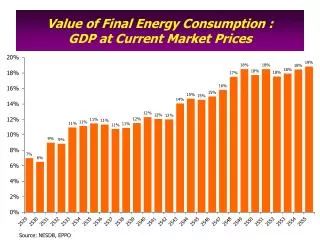
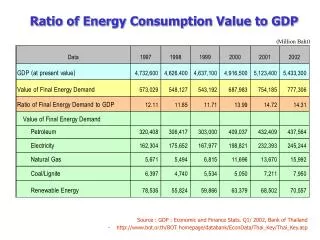
Ratio of Energy Consumption Value to GDP. ( Million Baht). Source : GDP : Economic and Finance Stats. Q1/ 2002, Bank of Thailand - http://www.bot.or.th/BOT homepage/databank/EconData/Thai_Key/Thai_Key.asp. Forecasted Value of National Energy Consumption in the Future.

E N D
Ratio of Energy Consumption Value to GDP (Million Baht) Source : GDP : Economic and Finance Stats. Q1/ 2002, Bank of Thailand - http://www.bot.or.th/BOT homepage/databank/EconData/Thai_Key/Thai_Key.asp
Forecasted Value of National Energy Consumption in the Future (Assumption: Energy Elasticity = 1.4 :1 and Est. GDP Growth Rate = 5% per year) Unit: Billion Baht
World Primary Energy Consumption per Dollar of Gross Domestic Product 1980- - 2001 25 , 000 20 , 000 Malaysia Dollars Using Market Exchange Rates Thailand 15 , 000 USA 10 , 000 UK . S . U 1995 France 5 , 000 Btu per Japan 0 1980 1981 1982 1983 1984 1985 1986 1987 1988 1989 1990 1991 1992 1993 1994 1995 1996 1997 1998 1999 2000 2001 Energy Intensity [Total Primary Energy Consumption Per Dollar of Gross Domestic Product] http://www.eia.doe.gov/pub/international/iealf/tablee1g.xls Comparison of Energy Intensity Economic structure in developed countries has been reformed to save energy
New Target 1 : 1 or lower Energy demand is 1.4 times higher than GDP growth Energy Elasticity = ∆tEnergy Consumption/ ∆tGDP Ave. Energy Elasticity 1.4 : 1.0 Thailand Source : EIA,DOE, BP Statistic Review of World Energy, EGAT
3,112 528 263 98 Value of Potential Energy Saved 3.1 trillion Baht can be saved from energy efficiency Unit : Billion Baht 1997 2002 2007 2012 2017 (Assumption: Energy Elasticity = 1:1 and GDP Growth Rate = 5% per year)
Energy Consumption by Economic Sector Agriculture 6% Resident & Commercial 21% Industry 36% Transport 37% 1992 1993 1994 1995 1996 1997 1998 1999 2000 2001 2002 Industry=Manufacturing+Mining+Construction
Share of Energy Demand in the Transportation Sector in Thailand
Power System Adequacy (Generation & Transmission Systems) Reserve Margin 15% Installed Capacity 2003 2004 2005 2006 2007 2008 2009 2010 2011 2012 2013 2014 2015 2016
Structure of Community Development Fund Utilization Community Development Fund (CDF) (3 Designated Authorizing Committees) Y% Z% X% Community Development Fund Committee (CDFC) Provincial Committees of the CDFC Community Committees of the CDFC • consider fund utilization for the development of quality of life and the environment at the provincial level • consider fund utilization for overall development of quality of life and the environment • consider fund utilization for the development of quality of life and the environment at the local level consider fund utilization under the CDF framework
Sichon Oil depot Trans-isthmus pipeline Oil depot Tap Lamu Strategic Energy Landbridge • Trading centre for BIMST-EC • Oil • Petrochemical Gulf of Thailand • Refinery & Petrochemical • complex • Strategic crude Stockpiling Refinery • Marine Maintenance/repair facility Petrochemical complex Pipeline • Length 240 KM. • Diameter 42” • Capacity 1.0 MBD • Tank Capacity 2 x 5.0 mm.BBL • Investment Cost 719 mm.USD Nakhon Srithammarat Phang Nga Krabi Existing road system Phuket Andaman Sea Trang