Download
1 / 34
350 likes | 515 Vues
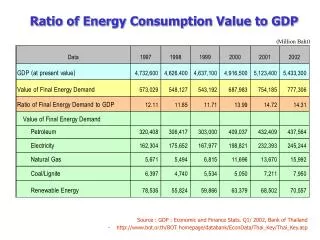
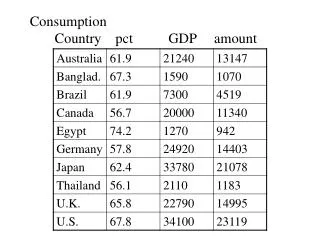
Consumption Country pct GDP amount. Country. GDP per Capita. Health Expenditure per Capita. Life Expect. Average Years in Poor Health. Preval- ence of HIV. Albania. 3600. 144. 72. 9.4. 0.01. Bangladesh. 1590. 57. 61.

E N D
Consumption Country pct GDP amount
Country GDP per Capita Health Expenditure per Capita Life Expect. Average Years in Poor Health Preval- ence of HIV Albania 3600 144 72 9.4 0.01 Bangladesh 1590 57 61 8.2 0.02 Brazil 7300 482 67 8.4 0.57 China 3920 176 70 7.4 0.07 Ethiopia 660 27 42 8.6 10.63 Germany 24920 2642 77 6.5 0.10 Nigeria 800 22 47 11.5 5.06 Russian Fed. 8010 368 66 6.6 0.18 United States 34100 4433 77 6.9 0.61 Source: World Bank website, http://www.worldbank.org/data/databytopic/class.htm, on April 29, 2002. Notes: GDP (for 2000) is via the purchasing power parity method; health care expenditures per capita were found by applying the 1990-98 average percentage of GDP spent on health care; life expectancy is estimated from birth; years spent in poor health and HIV are World Bank health risk indicators; HIV figures represent the percent of adults estimated to carry the virus.
Indifference Curve Analysis 1. Develop indifference curves 2. Develop budget constraint 3. Some basic analysis: a. changes in prices; b. changes in income; c. the Engels Curve 4. The Food Stamps Problem
Indifference curve: A collection of points for which the consumer is indifference between each of them and some reference point. Typically shown in the context of a two good world on a two-dimensional graph.
Determinants of Consumer Preferences Experience Demonstration effects Advertising Conspicuous consumption
The axiomatic approach to indifference • curves is a search for a minimum set • of assumptions regarding consumer • behavior through which to generate • indifference curves. • Standard axioms: • More is preferred to less—nonsatiation • Completeness—all points in a relation • Transitivity– A B; B C; A C
The marginal rate of substitution and the shapes and kinds of indifference curves. Perfect substitutes Perfect complements Steepness, what does it mean Do they shift or stay in place?
These two sets of indifference curves represent people who differ in their relative willingness to trade food for medicine. Which one is hungry? Careful.
The budget equation: • B = pogOG + pfF • OG = B/pog – pf/pogF Meaning: The budget equation will depict a curve in OG-Food space that is downward sloping (note: its derivative –pf/pog is negative).
Utility, a quantitative measure of satisfaction. a. utility is constant along an indifference curve.
b. higher indifference curves yield higher utility. c. utility is treated as ordinal in most cases “ordinal” measures are like 1st, 2nd, 3rd, etc “cardinal” numbers are like 1.0, 3.6, 7.1 etc (utility numbers are really “cardinal but arbitrary”)
Jeremy Bentham and Utilitarianism 1748-1832. For Bentham, utility was: 1. Metric (also called Cardinal, remember--today we think its ordinal). 2. Interpersonally comparable.
Bentham was extremely optimistic in these beliefs. If utility were metric, then society could correctly identify and measure exactly how happy or well-off America was, or Detroit, or this classroom. It would be scientific.
Nevertheless his utilitarianism proved useful in bringing reforms: 1. Prisons were made more humane. 2. Insane asylums were made more humane.
Who was Jeremy Bentham? And, what does he look like? Notice I said "what does he look like. Note: Although Bentham lived and wrote back in the 18th Century you can see what he looks like. Notice I said he.
Jeremy Bentham as he still appears in a glass case in University College of London, which he helped to found.
Applying calculus to find an expression for the slope of the other curve, the indifference curve: OG/F = - (U/F) /(U/OG) or, using an equivalent notation: OG/F = - MUf/MUog
At an equilibrium, tangency implies that the slope of the budget constraint equals the slope of the indifference curve: Hence,
Consumer equilibrium requires that pf/pog = MUf /MUog or MUf /pf = MUog /pog In words: The marginal utility per dollar of expenditure must be equal for each good.