Download
1 / 39
390 likes | 583 Vues
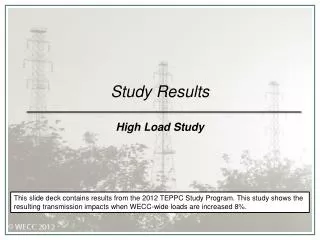
Study Results High EE/DG/DR Study. This slide deck contains results from the 2011 TEPPC Study Program. This study shows the results of an increase of EE/DG/DR policy and it impact on the interconnection . 2022 PC4 – High EE, DSM, DG.

E N D
Study ResultsHigh EE/DG/DR Study This slide deck contains results from the 2011 TEPPC Study Program. This study shows the results of an increase of EE/DG/DR policy and it impact on the interconnection.
2022 PC4 – High EE, DSM, DG Central Question: What impact do aggressive EE, DSM, and DG policies have on transmission and capacity needs relative to the 2022 Common Case? Assumptions Loads – decreased to reflect the assumption that “all cost-effective EE potential” is achieved throughout the West Transmission System – None Generation – • DG resources increased based on ‘interconnection potential’ of distributed PV and ‘technical potential’ of distributed CHP as estimated by E3 (link to E3 report) • RPS resources adjusted for lower loads due to EE and behind-the-meter DG, and for increased PV DG • DSM increased based on LBNL analysis of demand response potential estimated using an updated FERC DR Potential Estimates model Link to all SPSC input provided for this case
Study ExecutionBuild and run study in steps… • Perform EE load adjustments; + 2) Add DG resources, adjust RPS; + 3) Add DR and “tune” PC4 Results in similar order…
Distributed Generation Modeling Approach • Incremental DG (PV and CHP) modeled in the Common Case was first removed from the total potential DG estimates developed for PC4 • Incremental DG added to 2022 PC4 was scaled up for avoided transmission and distribution system losses • 6% for all areas except CA, 7% for CA (consistent with assumptions used to develop RPS requirements) • DG was distributed proportionally (to load) amongst largest area load busses Distributed proportionally Common Case DG Losses, 6% Potential DG
Distributed Generation Modeling Approach, continued • The following categories of distributed solar PV were modeled • Residential rooftop – modeled using NREL rooftop solar profiles (fixed tilt of 20º) • Commercial rooftop – modeling using solar profiles developed by E3 using PVWatts • Ground-mounted – modeled using NREL single-axis tracking solar profiles • Distributed CHP was modeled as follows: • Flat output • Heat rate = 6,000 Btu/kWh • Capacity factor = 85% All DG has behind-the-meter (BTM) and wholesale component (50/50 split)
2022 Incremental Distributed PV in PC1 and PC4 – Big Picture WECC total ~ 25,000 MW
2022 Incremental Distributed CHP in PC1 and PC4 – Big Picture WECC total ~ 9,900 MW
High EE and High DG Impacts to RPS Requirements Top 3 % change in Red
Overbuild of RPS Resources • Planned/future RPS resources removed as needed to meet adjusted RPS targets • After EE load adjustments • Again, after high DG adjustments • Ran out of planned/future resources to remove during the high DG adjustments • Increased PV counts towards RPS • Behind-the-meter PV and CHP reduces retail sales, hence reduces RPS targets
DR Modeling Approach Economic DR • Bus assignment assumptions: • Based on generator size • Based on bus size (real load) • Modeling technique - fixed-shape transaction (i.e. like wind) • 50-80 dispatch hours per year • Hours per dispatch, frequency – varies • LBNL uses area loads and load weighted LMPs to calculate dispatch • Monthly availability specified Interruptible DR • Bus assignment assumptions: • Based on generator size • Based on bus size (real load) • Modeling technique – high cost CT • ~20 dispatch hours per year • 4-6 hours per dispatch, 4-5 times per year • Min down time: 4 hours • Min up time: 3 hours • Modify heat rate (MMBtu/MWh) • Monthly availability specified More info
DR Modeling Implementation Run study PC4 w/ EE and DG Results to LBNL Add Economic DR Run study Run study Add Interruptible DR Tune Interruptible DR OK? Note: Same process for PC1 Check results No PC4 Done! Yes
PC4 Generation Results Takeaways Combined cycle - lower loads, CA/AB Cogen/Solar - study assumptions Wind - RPS impacts from study Dump – lower loads, BC hydro
Transmission Expansion Results – Changes in Dump Energy by State Path 3 congested?
PC4 Transmission Results Takeaways NW/CAN to CA - inexpensive NW resource free to meet CA load. COI and Path 3 congested as a result. Path 8 utilization Path 26 utilization
Transmission Expansion Results – Changes in Path Utilization Table 1 Five most congested paths P03 Northwest-British Columbia* P11 West of Crossover P08 Montana - Northwest* P66 COI P16 Idaho-Sierra * Table 2 Greatest change in path utilization P29 Intermountain-Gonder* P27Intermountain Power Project DC Line p66 coi p29 intermountain-go p26 northern-southern P16 idaho-sierra p11 west of crossover P26 Northern-Southern California* P45 SDG&E-CFE*
Additional Material • Hourly region to region transfers
P45 SDG&E-CFE Hourly Flow Back to presentation
P27 Intermountain Power Project DC LineHourly Flow Back to presentation
P03 Northwest-British Columbia Hourly Flow Back to presentation
P66 COI Hourly Flow Back to presentation
P29 Intermountain-Gonder 230 kV Hourly Flow Back to presentation
Transmission Expansion Results – Changes in Un-utilized Generation