Cohort Study
Cohort Study. Presenter : Dr Himani Moderator: Dr Subodh S Gupta. Types of Epidemiological study. Framework. Definition Study design Steps of study Identification of study population Measurement of exposure selection of study and comparison group


Cohort Study
E N D
Presentation Transcript
Cohort Study Presenter : Dr Himani Moderator: Dr Subodh S Gupta
Framework • Definition • Study design • Steps of study Identification of study population Measurement of exposure selection of study and comparison group Follow-up Analysis 4. Advantages and disadvantages 5. Biases 6. Variants of cohort study 7. Cohort study and other study designs 8. Role of Cohort study in Epidemiology
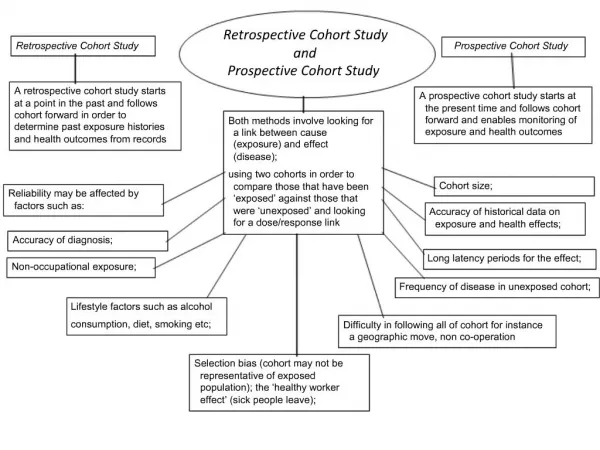
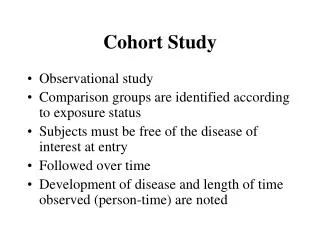
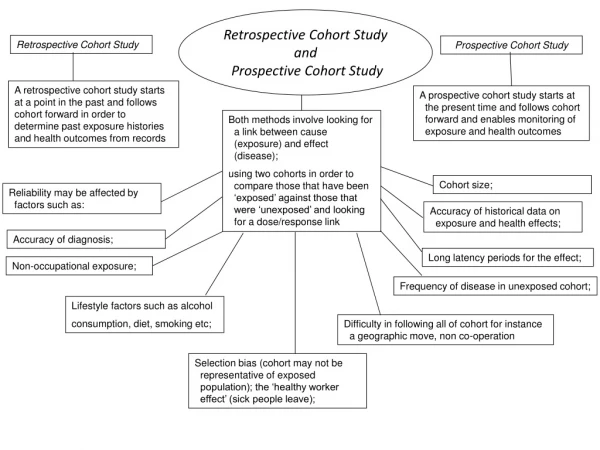
Definition • The cohort study is an observational analytical epidemiological study which, after the manner of an experiment, attempts to study the relationship between a purported cause (exposure)and the subsequent risk of developing disease. • Synonyms: Incidence studies, prospective studies, follow-up studies, longitudinal studies
Indication of Cohort study • When there is good evidence of exposure and disease. • When exposure is rare and incidence of disease amongst exposed group is more • When follow-up is easy • When sufficient funds are available
Types of cohort • Open Cohort: Subjects can leave and enter the cohort at any time • Closed Cohort : Fixed number of persons are followed over a specified time till the end point.
Steps of Cohort study • Identification of study population • Measurement of exposure • Selection of study and comparison group • Follow-up (for outcome measurement) • Analysis
Criteria for the selection of subjects in cohort • Free of disease of interest • Equally susceptible to development of the disease at the beginning of the study • Equivalent information (quantity and quality) should be available on exposure and disease • Both the groups should be accessible and available for follow- up.
Selection of Comparison group • Internal comparison • Single cohort enters the study • Later on, classified into study and comparison cohort based on exposure • External comparison • More than one cohort identified • e.g. Cohort of radiologist compared with ophthalmologists or smokers with non smokers • Comparison with general population rates • If no comparison group is available we can compare the rates of study cohort with general population • Frequency of cancer amongst asbestos workers compared with cancer in general population
Gathering data on exposure • Existing Records • Interviews, self administered questionnaire, mailed questionnaire • Examinations: medical and other special examinations • Measure of environment: measure of air pollution, exposure to radiation or other toxicological substances
Follow up Objectives of Follow up • uniform and complete follow-up of all cohort groups • complete ascertainment of outcome events • standardized diagnosis of outcome events. Methods: • correspondence with the subject and other informants, • periodic re-examination of the subjects, and • indirect surveillance of hospital records and death certificates.
Sample size calculation The estimated sample size n for cohort studies is calculated as N= [Zα √(1+1/m)p(1-p) +Zβ √ {p0(1-p0) / m} +p1(1-p1)]2 (po-p1)2 Where m = number of control subjects per experimental subject po= probability of events in control p1 =probability of events in experimental subjects p= p1+ m po m+1
Sample Size calculation When mean is available n=sample size µ1= population mean in group1 µ2= population mean in group2 µ1- µ2 = difference the investigator wishes to detect σ = population variance (SD) a= conventional multiplier for alpha =0.05 b= conventional multiplier for power = 0.80
Analysis of Cohort study • Relative risk or risk ratio • Risk difference • Attributable risk • Population Attributable Risk • Rate Ratio
Incidence (exposed) = Exposed persons who developedds= a/(a+b) All exposed person Incidence (Unexposed) = Unexposed persons who develop ds= c/(c+d) All unexposed persons Relative Risk = _Incidence (exposed)__ = _a / (a+b)_ Incidence (unexposed) c / (c+d) Risk difference = Incidence (exposed) – Incidence(nonexposed) = [a/(a+b)] – c/(c+d)]
Attributable Risk = Risk(exposed) – Risk(nonexposed) * 100 Risk (exposed) = (RR-1) * 100 RR Population Attributable Risk= Risk(Total) – Risk(unexposed) *100 Risk (total)
Incidence (exposed) = Exposed persons who develop ds= 200/10,000 = 0.02 • All exposed person • Incidence (Unexposed) = Unexposed persons who develop ds= 100/10,000 =0.01 • All unexposed persons • Relative Risk = _Incidence (exposed)__ = _0.02 = 2 • Incidence (unexposed) 0.01 • Risk difference = Incidence (exposed) – Incidence(nonexposed) • = 0.02 – 0.01 = 0.01
Attributable risk: {(2-1)/2}*100 = 50% • Population attributable risk= {(0.015- 0.01)/0.02}*100 = 25%
Cumulative incidence Number of new cases of disease occurring over a specified period of time in a population at risk • Incidence density Number of new cases of disease occurring over a specified period of time in a population at risk throughout an interval
Rate ratio=rate of outcome amongst exposed/ rate of outcome among unexposed Rate ratio= [a/ PT(exposed)] / [b/PT(unexposed)]
Survival Analysis • Statistical method for analyzing longitudinal data on occurrence of events. • Events can be Time to death time to onset of disease length of stay in hospital viral load measurement
Survival analysis • Life table approach • Kaplan Mier • Cox Regression
Clinically suspected cases Event free survival
Advantages of cohort study • Direct calculation of risk ratio (relative risk) • Yield information on incidence of disease • Clear temporal relationship between exposure and disease • Particularly efficient for study of rare exposures • Can yield information on multiple outcomes of a particular exposure • Minimize bias • Strongest observational design for establishing cause and effect relationship
Disadvantages of cohort study • Time consuming • Often requires a large sample size • Expensive • Not efficient for study of rare diseases • Losses to follow-up may diminish validity • Changes over time in diagnostic methods may lead to biased results
Biases • Selection bias • Information bias/ Misclassification bias • Bias due to confounding • Post hoc bias.
Selection Bias • the group actually studied does not reflect the same distribution of factors (such as age, smoking, race, etc.) as occurs in the general population. • This is due to members refuse to participate records are not available Particular subgroup may not be representative of general population • Resolution: by careful selection of individuals for inclusion in the study and by making every attempt to characterize differences that may exist between respondents and non-respondents.
Selection Bias in historical cohort True RR =2.0 20% of employee heath records were lost or discarded, except in “solvent” workers who reported illness (1%loss) RR=2.42
Follow- up Bias • Some members of the original cohort drop-out of the study • If the loss to follow-up occurs equally in the exposed and unexposed groups, and their characteristics are nearly similar, the internal validity should not be affected. • Resolution: by intensive follow up comparison of baseline characteristics of those who are loss to follow up and those who are not
Differential loss to follow up in a prospective cohort study on oral contraceptives and thromboembolism(TE) RR= 2 (truth) After 40% loss to follow up RR=1
Information Bias • Also known as ‘misclassification bias’ • result from measurement errors, imprecise measurement, and misdiagnosis for whatever reason. • Resolution: by using well-defined precise measurements and classification criteria for which the sensitivity and specificity have been determined.
Post hoc bias • use of data from a cohort study to make observations that were not part of the original study intent. • These findings should be treated as hypotheses that are an appropriate subject for additional studies.
Bias due to Confounding • When other factors that are associated with both the outcome and exposure variables do not have the same distribution in the exposed and unexposed groups. • Confounder should have 3 criterias: • it should be cause of disease • it is associated with risk of disease • it should not be an intermediate step in causal pathway between exposure and disease
During design of study randomisation restriction matching • During analysis stratification statistical modelling
Variant of Cohort study • Nested Case-Control study
Role of cohort study in epidemiology • Natural history of the disease: For example, cohort studies of individuals who were infected with HIV revealed that a drop in the level of T lymphocytes having the CD4 marker was associated with being infected with HIV, and that a further decline in CD4 cells was associated with developing clinical symptoms and AIDS • Causation of the disease: eg. role of high blood pressure as a major cause of stroke, myocardial infarction, and chronic kidney disease. • Evaluating public health programmes: If relevant statistics are not routinely available, cohort studies can be used to assess whether the programme has an impact by calculating the incidence of a disease.
References 1. Gordis L, Epidemiology, Third Edition(2004), Elsevier Saunders. 2. Detels R, McEwen J, Beaglehole R, Tanaka H, Oxford Textbook of Public Health, Fourth edition(2002), Oxford University Press 3. Beaglehole R, Bonita R, Kjellstrom T, Basic Epidemiology, 2nd Edition(2006)WHO. 4. Hill, Mc Graw, Medical Epidemiology, 4th Edition(2007), Lange. 5. Bhalwar R, Vaidya R, Tilak R, Gupta R, Kunte R, Textbook of Public Health and Community Medicine. 1st Edition (2009). 6. Kasiulevičius V, Šapoka V, Filipavičiūtė R, Sample size calculation in epidemiological studies, Gerontologija 2006; 7(4): 225–31 7. Grimes DA, Schulz KF, Cohort studies: marching towards outcome, Lancet2002;359:341-45.