Sinusoidal Functional Form and SHM Perspective: Digitization and Animation
50 likes | 73 Vues
Explore the concept of sinusoidal functional forms and simple harmonic motion through digitization and animation. Learn how analog signals are processed into digital data and stored in computer memory.

Sinusoidal Functional Form and SHM Perspective: Digitization and Animation
E N D
Presentation Transcript
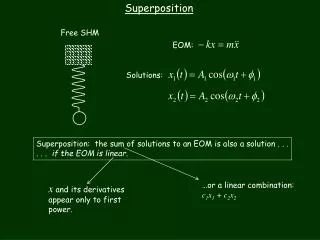
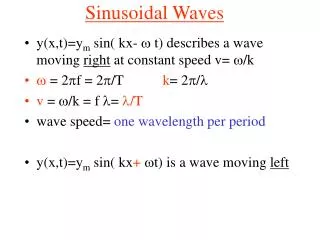
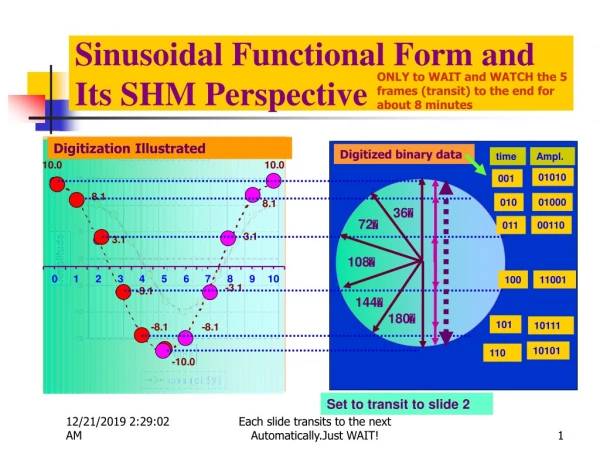
Sinusoidal Functional Form and Its SHM Perspective ONLY to WAIT and WATCH the 5 frames (transit) to the end for about 8 minutes • This cosine curve would now be represented as a consequence of a synchronized constant- amplitude- vector- rotation.This leads to the perspective for the simple harmonic motion associated with the sinusoidal functional forms. Digitization Illustrated Digitized binary data time Ampl. 01010 001 01000 010 36 72 00110 011 108 100 11001 144 180 101 10111 10101 110 Set to transit to slide 2 Each slide transits to the next Automatically.Just WAIT!
To display a Webpage on the use of animations classroom teacching CLICK HERE Animated Illustration of Digitization of an ANALOG Function. Numbers in Decimals can be Binary Indicators of DIGITIZER Timings Show up in sequence Set to transit to slide 3
Digitizing Analog Signals and Processing Digital Data in DIGITAL COMPUTERS Set to transit to slide 4 • Digitization of the function at times 0,4,8…….24 would result in the values in column 3 in the table On L.H.S the plotted function is On the L.H.S appears the table of values of e-t/8 as a functionof the time ‘t’ Animated At these equally spaced specified times, the exponential curve is sampled for its amplitude value and displayed The sequence of times at equal intervals show up This digitzation process can be displayed for illustration as it would be animated herein
After Digitization? Store Digitized Binary Data in the Computer memory Input these DATA into a PROGRAM, run and get the required output 001 1010 010 1000 011 0110 --- ---- --- ---- output Set to show slide 5
A Concerted Reaction Mechanism Animated Illustration C A-B C-A Press ‘Esc’ to stop the running show The last slide