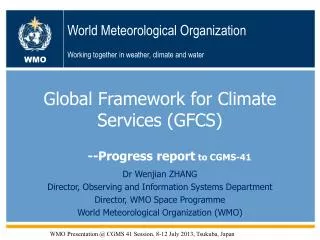
Regional Impact Studies in the COSMO Community: Assimilation Techniques and Results
Detailed study on radar reflectivity assimilation and its impact on forecasting convective systems within the COSMO-EU and COSMO-DE models. Latent heat nudging method explored for improving precipitation forecasts. Insights from WMO Impact Workshop 2008.

Regional Impact Studies in the COSMO Community: Assimilation Techniques and Results
E N D
Presentation Transcript
Regional impact studies performed in the COSMO community • Alexander Cress, Reinhold Hess Christoph Schraff • German Weather Service , Offenbach am Main, Germany • Email: Alexander.Cress@dwd.de • Introduction • Use of radar reflectivity measurements • Assimilation of satellite radiances with 1D-VAR and Nudging • Use of VAD profiles, GPS tomography data and scatterometer winds • E-AMDAR humidity data • Experiment testing a reduced radiosonde network over Europe (EUCOS proposal) • Summary IV WMO Impact Workshop 2008 Alexander Cress
Lokal-Model COSMO-EU (LME) und COSMO-DE (LMK) COSMO-EU (regional model): non-hydrostatic, rotated lat-lon grid, mesh-size: 7km terrain-following hyprid coordinate with 40 layers up to 20 hPa forecast range: 78 h every 6 hours prognostic cloud ice, prognostic rain schemes boundary values from GME Analysis: continuous nudging scheme observations: radiosonde, pilots, wind profiler, aircraft, synops, buoys, ships cut-off: 2h30min variational soil moisture analysis COSMO-DE (lokal model): similar to COSMO-EU forecast range 18 h every 3 h mesh-size: 2.8 km, explicit convection latent heat nudging of radar reflectivities boundary values of COSMO-EU ww
Data base • Reflectivity from „Precipitation scan“ (DX-Produkt): • Elevation angle: 0.5°-1.8° • Spatial resolution: 1km x 1°,max. Range 128 km • Temporal resolution: 5 Minuten • Quality control mechanism: Clutter, spikes, rings, AnaProp, … • Data processing: • Correction of orographic shading • variable Z-R-relations • Composit of 16 German locations • Bright band correction
Basic principles of latent heat nudging • LHN: specific form of Nudging to assimilate radar reflectivities respectivly the derived precipitation • Problem: precipitation is a „derived“ model parameter with limited feedback on the thermodynamic structure of the model • Aim: Adjust the dynamic of the model, that it produces the observed precipitation at the right place and time ⇨ relation to a thermodynamic relevant model variable (temperature, humidity) is required • Solution: Adjustment of the latent heat in the model yields to a temperature (humidity) change IV WMO Impact Workshop 2008 Alexander Cress
Results of an operational application Animation of hourly precipitation 26. August 2006 Assimilation: 09 UTC Radar Without LHN With LHN
Results of an operational application Animation of hourly precipitation sum 26. August 2006 Assimilation: 10 UTC Radar Without LHN With LHN
Results of an operational application Animation of hourly precipitation 26. August 2006 Assimilation: 11 UTC Radar Without LHN With LHN
Results of an operational application Animation of hourly precipitation 26. August 2006 Assimilation: 12 UTC Radar Without LHN With LHN
Results of an operational application Animation of hourly precipitation 26. August 2006 Free forecast 12 UTC + 1 H Radar Without LHN With LHN
Results of an operational application Animation of hourly precipitation 26. August 2006 Free forecast 12 UTC + 2 H Radar Without LHN With LHN
Results of an operational application Animation of hourly precipitation 26. August 2006 Free forecast 12 UTC + 3 H Radar Without LHN With LHN
Results of an operational application Animation of hourly precipitation 26. August 2006 Free forecast 12 UTC + 4 H Radar Without LHN With LHN
Results of an operational application Animation of hourly precipitation 26. August 2006 Free forecast 12 UTC + 5 H Radar Without LHN With LHN
Results of an operational application Animation of hourly precipitation 26. August 2006 Free forecast 12 UTC + 6 H Radar Without LHN With LHN
Results of an operational application 24H precipitation sum: 26.08.2006 (6 UTC – 6 UTC) Assimilation Radar Without LHN With LHN
Free forecast Free forecast ASS ASS Results of an operational application Skill scores for 32 runs in AUGUST 2006 Threshold 1.0 mm/h ETS FBI LHN NoLHN LHN NoLHN
Free forecast Free forecast ASS ASS Results of an operational application Skill scores for 32 runs in AUGUST 2006 Threshold 5.0 mm/h ETS FBI LHN NoLHN LHN NoLHN
Summary and outlook • Radar reflectivities are assimilated within the COSMO-DE to improve the forecasts of convective systems • Latent Heat Nudging (LHN) of radar reflectivities prove to be a proper method • Assumption: Precipitation rate at the surface is proportional to the vertical integral of latent heat release within a model column • A positive impact of the LHN during the assimilation could be demonstrated • The positive benefit of LHN can be verified up to nine hours in the free forecast • Additional investigations are needed to extent the positive benefit beyond nine hours (additional use of radar winds to adjust the dynamic structure in the model) • Inclusion of European radar sites
1DVAR + Nudging COSMO-Project:Assimilation of satellite radiances with 1D-Var and NudgingGermany, Italy, Poland • Goals of Project: • Assimilate radiances (SEVIRI, ATOVS, AIRS/IASI) in COSMO-EU • Explore the use of nonlinear observation operators with Nudging i.e. RETRIEVE temperature and humidity profiles and then nudge them as “pseudo”-observations
T-‘analysis increments’ from ATOVS, after 1 timestep (sat only), k = 20 no thinning of 298 ATOVS 30 ATOVS by old thinning (3) 30 ATOVS, correl. scale 70% 40 ATOVS by thinning (3) 82 ATOVS by thinning (2) 82 ATOVS, correl. scale 70% Reinhold Hess, 20 Athens, 2007
T-‘analysis increments’ from ATOVS, after 30 minutes (sat only), k = 20 no thinning of 298 ATOVS 30 ATOVS by old thinning (3) 30 ATOVS, correl. scale 70% 40 ATOVS by thinning (3) 82 ATOVS by thinning (2) 82 ATOVS, correl. scale 70%
GME forecast for 48 hours Reinhold Hess, 22 Athens, 2007
mean sea level pressure & max. 10-m wind gusts valid for 20 March 2007 , 0 UTC m/s + 48 h, REF (no 1DVAR) analysis + 48 h, 1DVAR-THIN3 + 48 h, 1DVAR-THIN2
Reinhold Hess, 24 COSMO Priority Project: Assimilation of Satellite Radiances with 1DVAR and Nudging Status of Developments September 2007 • technical implementation ready (ATOVS/SEVIRI, including debugging) • basic monitoring of radiances (day by day basis) • basic set up, first case studies available • tuning required • nudging coefficients/thinning of observations • bias correction/stratosphere • background errors/humidity correlations • long term evaluation • already studies on spatially localised background error covariance matrices (SREPS for SEVIRI) • implementation for AIRS/IASI has just started ww To be done: tuning, testing, tuning • Use of 1D-Var developments already for other activities: • GPS tomography • Radar reflectivities Athens, 2007
Use of VAD Wind profiles in the Lokal Modell of DWD • Vertical Wind Profiles provided by • Doppler weather radars using the • Velocity-Azimuth Display (VAD) technique • Before using VAD wind profiles extensive • monitoring has to be done • Bad measurement sides are blacklisted • Use of VAD wind profiles in LM in the • same way as pilot wind profiles IV WMO Impact Workshop 2008 Alexander Cress
VAD statistics of background (LME) - observations Mean over used VAD stations (020207 – 120207) Left: BIAS Right: RMS • BIAS and RMS comparable to • radiosonde statistics • Almost no bias in wind velocity • and direction IV WMO Impact Workshop 2008 Alexander Cress
10204 02933 IV WMO Impact Workshop 2008 Alexander Cress
Station: 10338 blacklisted IV WMO Impact Workshop 2008 Alexander Cress
Verification of LME forecasts against radiosondes Results Mainly neutral Slightly positive for + 48 h RMS geopotential height IV WMO Impact Workshop 2008 Alexander Cress
1.2 Multi-Sensor Humidity Analysis (incl. GPS-obs)Daniel Leuenberger (MCH) GPS tomography: • comprehensive monitoring (14 months) of quasi-operational tomography profiles (at CSCS) against Payerne radiosonde and COSMO fields done • results: tomographic refractivity profiles have rather large errors unlessCOSMO forecasts are included as background info • start working on assimilating humidity profiles derived from tomography retrievals • new PhD (Perler) at ETH started working on tomography method itself • BIAS – wet bias below 1500 m, large dry bias around 2000 m • Summer: 10 – 15 ppm (~1.5-2.5 g/kg) or ~35% • Winter: 5 ppm (~ 0.75 g/kg) or 20% • (much) larger than NWP model (+12h / +24h fc) • STD – Summer: up to 12 ppm (~1.8 g/kg) or 10% – 30% in PBL • Winter: up to 7 ppm (~1 g/kg) or 20% – 40% in PBL • slightly smaller than NWP model (+12h / +24h fc)
1.4 Assimilation of Screen-level Observations PBL AnalysisJean-Marie Bettems, Oliver Marchand, Andre Walser (MCH), Andrea Rossa + collaborators (ARPA-Veneto), Antonella Sanna (ARPA-Piemonte) • main objects: data selection, extrapolation to 10 m, vertical + horizontal structure functions • up to now: only case studies done • Diploma work at MCH (Lilian Blaser): 9 case studies, standard assimilation parameters • 10-m wind ass.: analysis impact: positive at surface, also for upper-air wind speed forecast impact: neutral, except 1 positive case (+8 h) • 2-m temperature & humidity additionally (1 convective case): clear positive impact on analysis of surface parameters, negative for upper-air wind speed • surface pressure (1 winter case): slight negative impact on 10-m wind, not due to geostrophic correction • need to select representative stations, need appropriate vertical structure functions (impact of screen-level obs reaching high)
5 June 2002, 12 UTC - 18-h precipitation sum 5 June 2002, 12 UTC diurnal cycle T2m 1.4 Assimilation of Screen-level Observations PBL AnalysisAntonella Sanna, M. Milelli, D. Cane, D. Rabuffetti (ARPA-Piemonte) • Sensitivity study (1 case with floodings, 2.8 km resolution) on assimilation of non-GTS data and soil moisture initialisation (PREVIEW framework): • clear positive impact from ass of high-res 10-m wind and 2-m temperature data and with nudging parameters adjusted to fit denser obs network • no benefit from replacing IC soil moisture by FEST-WB (hydrological model for floods) CTRL: interpol. ana SET2: standard nudging SET3: + nudge T2m, v10m adjusted parameters SET4: + init. soil moisture analysis 12-h forecast T -profiles
Opr (no QSCAT) – Exp (QSCAT) PMSL 19 June 2007, 9 UTC hPa QSCAT 19 June 2007, 6 – 9 UTC 15 W 50N 48N 1.5 Assimilation of Scatterometer WindHeinz-Werner Bitzer (MetBw), Alexander Cress, Christoph Schraff (DWD) • nudging of scatterometer wind data as buoy observations technically implemented, taking into account all quality control / bias correction steps developed for use in GME • idealised case studies: model rejects largest part of 10-m wind info unless mass field is explicitly balanced derive surface pressure analysis correction in geostrophic balance with 10-m wind analysis increments (implies need to solve Poisson equation): implemented, model now accepts data • first real case study computed
1.5 Assimilation of Scatterometer WindHeinz-Werner Bitzer (MetBw), Alexander Cress, Christoph Schraff (DWD) analysis (21 June 2007, 12 UTC) + 48-h , no QSCAT + 48-h , with QSCAT m/s 10-m wind gusts minor impact, central pressure error reduced from – 5 hPa to – 3 hPa
E-AMDAR humidity measurements What additional humidity data from airplanes will be of use to regional NWP ? What potential savings to the radiosonde network (complemt or reduction) will such a programme bring? Three Lufthansa airplanes are implemented with humidity sensor First humidity data in bufr format became available at the beginning of 2007 DWD started a data monitoring (obs – bg) using its global (GME) and regional model (LME) IV WMO Impact Workshop Alexander Cress
00 UTC 12 UTC All aircrafts IV WMO Impact Workshop Alexander Cress
00 UTC 12 UTC EU4593 IV WMO Impact Workshop 2008 Alexander Cress
00 UTC 12 UTC EU5331 IV WMO Impact Workshop 2008 Alexander Cress
Summary of the preliminary results • Monitoring and blacklisting is very important for a successful use • of VAD wind profiles. Quality differs substantially from station • to station • VAD wind measurements produce no additional noise in the analyses • The wind and geopotential height fields are in balance for different • pressure levels => wind observations are successfully used in the • Lokal Modell • Overall impact of VAD wind profiles on forecast quality is neutral • GPS tomography refractivity profiles have rather large errors • unless COSMO forecasts are included as background IV WMO Impact Workshop 2008 Alexander Cress
Summary of the preliminary results • Assimilation of screen-level observations show positive impact • on surface analysis but neutral to slightly negative for upper-air • analysis • Small positive impact of using QuikScat scatterometer winds in • nudging assimilation of COSMO-EU • Monitoring of AMDAR humidity profiles showed a strong negative • humidity bias (higher than radiosondes) decreasing with height • and also a warm temperature bias IV WMO Impact Workshop 2008 Alexander Cress
Experiment testing a reduced radiosonde network over Europe • Experimentdesign • Following a EUCOS Redesign proposal • Only 32 Radiosondenstations in Europe (EUCOS Area) • With emphasis on the western borders of Europe and offshore islands v • No changes over eastern Europe • All other observing systems unchanged • Time range: 09.02.2006 to 13.03.2006 • Assimilation und forecasts (00 und 12 UTC) with COSMO-EU IV WMO Impact Workshop 2008 Alexander Cress
Sea surface pressure bias 09.02.06 – 13.03.06 EUCOS Experiment Routine 12 UTC 00 UTC Verification area: 40oN – 60oN and -5oW – 25oE IV WMO Impact Workshop 2008 Alexander Cress
Frequency Bias of low level clouds 09.02.06 – 13.03.06 EUCOS Experiment Routine 00 UTC 12 UTC Verification area: 40oN – 60oN and -5oW – 25oE IV WMO Impact Workshop 2008 Alexander Cress
Bias of wind direction 09.02.2006 – 13.03.2006 EUCOS Experiment Routine 00 UTC 12 UTC Verification area: 40oN – 60oN and -5oW – 25oE IV WMO Impact Workshop 2008 Alexander Cress
Summary • Reducing the radiosonde network has a negative impact on the • quality of COSMO-EU analysis • Negative impact was largest on humidity fields • Negative impact diminished after 12 hours • Slightly negative impact on sea surface pressure • On average scattered (broken) clouds are overestimated and strong • clouds (overcasting situations) are underestimated • Increasing wind direction bias during forecast • Negative impact is higher at 00 UTV compared to 12 UTC • (Compensation by aircraft data ?)