Innovations in Data Assimilation for Weather Forecasting
350 likes | 376 Vues
Exploring advancements in data assimilation techniques for improving weather forecasting accuracy, with comparison examples and statistical insights. Toy examples illustrate key concepts of integrating observations into weather models.

Innovations in Data Assimilation for Weather Forecasting
E N D
Presentation Transcript
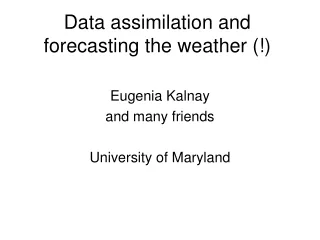
Data assimilation and forecasting the weather (!) Eugenia Kalnay and many friends University of Maryland
Content Forecasting the weather - we are really getting better… Why: Better obs?Better models?Better data assimilation? Intro to data assim: a toy example, we measure radiance and we want an accurate temperature Comparison of the toy and the real equations An example from JMA comparing 4D-Var and LETKF (a type of Ensemble Kalman Filter)
Typical 6-hour analysis cycle Forecast: prior, followed by Analysis (IC): posterior
Typical distribution of the observing systems in a 6 hour period: a real mess: different units, locations, times Typical distribution of observations in +/- 3hours
Typical distribution of the observing systems in a 6 hour period: a real mess: different units, locations, times Typical distribution of observations in +/- 3hours
i k Model grid points (uniformly distributed) and observations (randomly distributed). For the grid point i only observations within a radius of influence may be considered
Intro. to data assimilation: a toy example Assume we have an object, a stone in space We want to estimate its temperature T (oK) accurately by measuring the radiance y (W/m2) that it emits. We have an observation model: We also have a forecast model for the temperature We will derive the data assim eqs (KF and Var) for this toy system (easy to understand!) Will compare the toy and the real huge vector/matrix equations: they are the same!
Toy temperature data assimilation, measure radiance We have a forecast Tb (prior) and a radiance obs The new information (or innovation) is the observational increment: We assume that the obs. and model errors are gaussian The innovation can be written in terms of errors: where includes changes of units and observation model nonlinearity, e.g.,
Toy temperature data assimilation, measure radiance We have a forecast Tb and a radiance obs From an OI/KF (sequential) point of view: or In OI/KF we choose w to minimize the analysis error and obtain
Toy temperature data assimilation, measure radiance From an OI/KF point of view the analysis (posterior) is: with Note that the scaled weight is between 0 and 1 If If The analysis interpolates between the background and the observation, giving more weight for smaller error variances.
Toy temperature data assimilation, variational approach We have a forecast Tb and a radiance obs Innovation: From a 3D-Var point of view, we want to find a Tathat minimizes the cost function J: This analysis temperature Ta is closest to both the forecast Tb and the observation yo and maximizes the likelihood of Ta~Ttruth given the information we have. It is easier to find the analysis increment Ta-Tb that minimizes the cost function J
Toy temperature data assimilation, variational approach We have a forecast Tb and a radiance obs Innovation: From a 3D-Var point of view, we want to find (Ta -Tb) that minimizes the cost function J: Now So that from we get or where now
Typical 6-hour analysis cycle Forecast phase, followed by Analysis phase
Toy temperature analysis cycle (Kalman Filter) Forecasting phase, from ti to ti+1: Forecast error: So that we can predict the forecast error variance (The forecast error variance comes from the analysis and model errors) Now we can compute the optimal weight (KF or Var, whichever form is more convenient, since they are equivalent):
Toy temperature analysis cycle (Kalman Filter) Analysis phase: we use the new observation compute the new observational increment and the new analysis: We also need the compute the new analysis error variance: from we get now we can advance to the next cycle
Summary of toy system equations (for a scalar) We use the model to forecast Tb and to update the forecast error variance from to At The analysis is obtained by adding to the background the innovation (difference between the observation and the first guess) multiplied by the optimal weight The optimal weight is the background error variance divided by the sum of the observation and the background error variance. ensures that the magnitudes and units are correct.
Summary of toy system equations (cont.) The optimal weight is the background error variance divided by the sum of the observation and the background error variance. ensures that the magnitudes and units are correct. Note that the larger the background error variance, the larger the correction to the first guess.
Summary of toy system equations (cont.) The analysis error variance is given by “The analysis error variance is reduced from the background error by a factor (1 - scaled optimal weight)” This can also be written as “The analysis precision is given by the sum of the background and observation precisions”
Equations for toy and real huge systems These statements are important because they hold true for data assimilation systems in very large multidimensional problems (e.g., NWP). Instead of model, analysis and observational scalars, we have 3-dimensional vectors of sizes of the order of 107-108 We have to replace scalars (obs, forecasts) by vectors and their error variances by error covariances:
Interpretation of the NWP system of equations “We use the model to forecast from to ” At “The analysis is obtained by adding to the background the innovation (difference between the observation and the first guess) multiplied by the optimal Kalman gain matrix” “The optimal weight is the background error covariance divided by the sum of the observation and the background error covariance. ensures that the magnitudes and units are correct. The larger the background error variance, the larger the correction to the first guess.”
Interpretation of the NWP system of equations Forecast phase: “We use the model to forecast from to ” “We use the linear tangent model and its adjoint to forecast B” “However, this step is so horribly expensive that it makes KF unfeasible”. “Ensemble Kalman Filter solves this problem by estimating B using an ensemble of forecasts.”
Summary of NWP equations (cont.) The analysis error covariance is given by “The analysis covariance is reduced from the background covariance by a factor (I - scaled optimal gain)” This can also be written as “The analysis precision is given by the sum of the background and observation precisions” “The variational approach and the sequential approach are solving the same problem, with the same K, but only KF (or EnKF) provide an estimate of the analysis error covariance”
Comparison of 4-D Var and LETKF at JMAT. Miyoshi and Y. Sato • 4D-Var and EnKF are the two advanced, feasible methods • There will be a workshop on them in Buenos Aires (Nov’08)!!! • In Ensemble Kalman Filter the background error covariance B is approximated and advanced in time with an ensemble of K forecasts. In the subspace of the ensemble, B=I so that matrix inversions are efficient. • So far, comparisons show EnKF is slightly better than 3D-Var, but there has not been enough time to develop tunings • At JMA, Takemasa Miyoshi has been performing comparisons of the Local Ensemble Transform Kalman Filter (Hunt et al., 2007) with their operational 4D-Var • Comparisons are made for August 2004
Comparison of 4-D Var and LETKF at JMAT. Miyoshi and Y. Sato N.H. Tropics S.H. AC RMS error Bias
Comparison of 4-D Var and LETKF at JMAT. Miyoshi and Y. Sato N.H. Verifying against Rawinsondes! Tropics S.H. RMS error Bias
Comparison of 4-D Var and LETKF at JMA18th typhoon in 2004, IC 12Z 8 August 2004T. Miyoshi and Y. Sato operational LETKF
Comparison of 4-D Var and LETKF at JMARMS error statistics for all typhoons in August 2004T. Miyoshi and Y. Sato Operational 4D-Var LETKF
Summary • Data assimilation methods have contributed much to the improvements in NWP. • A toy example is easy to understand, and the equations are the same for a realistic system • Kalman Filter (too costly) and 4D-Var (complicated) solve the same problem (if model is linear and we use long assimilation windows) • Ensemble Kalman Filter is feasible and simple • It is starting to catch up with operational 4D-Var • Important problems: estimate and correct model errors & obs. errors, optimal obs. types and locations, tuning additive/multiplicative inflation, parameters estimation,… • Tellus: 4D-Var or EnKF? In press • Workshop in Buenos Aires Nov’08