Download
1 / 52
520 likes | 724 Vues
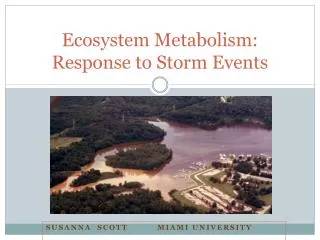
Ecosystem Metabolism 1: Primary Production. Population – distinct group of individuals of a species that live, interbreed, and interact in the same geographic area.

E N D
Population – distinct group of individuals of a species that live, interbreed, and interact in the same geographic area. • Community – includes all of the populations of organisms that live and interact with one another in a given area at a given time. • Ecosystem – consists of a self-sustaining, self-regulating community of organisms interacting with the physical (abiotic) environment within a defined geographical environment.
Levels of Integration: Landscapes Ecosystems Communities Species Populations Individual Organisms Organ Systems Organs Tissues Cells Subcellular Organelles Molecules Ecosystem Metabolism: -requires constant energy input
Energy Flow in Ecosystems Producers Consumers Decomposers
Two Laws of Thermodynamics • First Law: Energy cannot be created or destroyed, but it can be changed from one form to another. • Second Law: Energy cannot be changed from one form to another without loss of usable energy.
Second law First law One Way Flow of Energy When energy transformations occur, energy is neither created nor destroyed (1st Law) but there is always loss of usable energy, usually as heat (2nd Law).
Living Organisms Need Energy • Autotrophs – gain energy from the sun and materials from non-living sources • Plants, algae, phytoplankton (primary producers) • Heterotrophs – gain energy and materials from eating other living organisms • Herbivores eat plants (primary consumers) • Carnivores eat animals (secondary/tertiary consumers) • Omnivores eat both plants and animals • Decomposers – gain energy and materials from organic material • Mushrooms, bacteria, some invertebrates
Solar energy converted to chemical energy CO2 converted to Carbohydrate Solar energy + 6CO2 + 6H2O→ C6H12O6 + 6O2 Photosynthesis: Happy Rays of Sunshine You need to know this O2 (to air) CO2 (from air) C6H12O6 H2O
Overview of Cellular Respiration • Cellular respiration is the step-wise release of energy from molecules (usually carbohydrates) used to synthesize ATP molecules. • This is an aerobic process that requires oxygen (O2) and gives off carbon dioxide (CO2), and involves the complete breakdown of glucose to carbon dioxide and water: • C6H12O6+6O2→6CO2 + 6H2O +energy(in form of ATP)
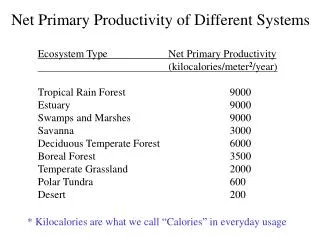
Primary production - the synthesis of organic matter by autotrophs • Always measured as a rate per unit of time • Sugar cane farmers kg/ha/yr cane production • To accumulate organic matter, photosynthesis must be greater than respiration • Compensation point – when photosynthesis = respiration • No growth / no reproduction
Two Measures of Production = = NPP = GPP - Respiration You need to know this
Primary Productivity Heat Energy Chemical Energy (ATP) Solar Energy CO2 Respiration Photosynthesis C6H12O6 O2 Available to Consumers Biomass (g/m2/yr) GPP NPP
Measuring Primary Production: Terrestrial • Primary production measured as a rate per unit time • Can measure CO2 uptake rate during the day = net production • CO2 released at night = respiration
Energetic Equivalents 12H20 + 6CO2 + 2966kj (solar energy) C6H12O6 + 6O2 + 6H20 • Absorption of 6 moles of CO2 indicates that 2966kj of energy has been absorbed • This gives us a relationship between carbonaccumulated and energy gained • We can determine the amount of carbon in a plant by measuring the amount of energy in that plant
Simple Method to Measure Primary Production: Harvest Method B = B2 – B1 • B = biomass change in the community between time 1 (t1) and time 2 (t2) • B1 = biomass at (t1) • B2 = biomass at (t2)
Harvest Method • Whole plant, aerial production, or root production • Two possible losses must be recognized L = biomass losses by death of plants or plant parts G = biomass losses to consumer organisms • With those values: NPP = B + L + G
Harvest Method Energy Determination • NPP can be converted to energy by measuring the caloric equivalent of the material in a bomb calorimeter Golly 1961
Aquatic Primary Production • The most important primary producers in aquatic systems are phytoplankton • Single cell plants suspended in the water column • Estimate primary production by measuring gas-exchange using light bottle dark bottle • Light bottle determines oxygen produced by photosynthesis • Dark bottle measures oxygen consumed by respiration
Measure initial oxygen concentration in both bottles Place bottles in water for a specific period during the day Measure final oxygen concentration in both bottles Light – Dark Bottle LBI = initial O2 in the light bottle DBI = initial O2 in the dark bottle LBF = final O2 in the light bottle DBF = final O2 in the dark bottle GPP = LBF – DBF (Total oxygen produced) NPP = LBF – LBI (Oxygen increase) Respiration = DBI – DBF(Oxygen decrease)
GPP = LBF – DBF (Total oxygen produced) NPP = LBF – LBI (Oxygen increase) Respiration = DBI – DBF(Oxygen decrease) LBI = 5.3 DBI = 5.3 LBF = 6.8 DBF = 4.2; 1 hr GPP = LBF – DBF = 6.8 – 4.2 = 2.6 mg/L/hr NPP = LBF – LBI = 6.8 – 5.3 = 1.5 mg/L/hr Respiration = DBI –DBF= 5.3 – 4.2 = 1.1 mg/L/hr NPP = GPP – Respiration = 2.6 – 1.1 = 1.5 mg/L/hr
What Does Production Actually Mean?? • More carbon fixed from the atmosphere = more food available • The greater the productivity, the greater the biomass of heterotrophs that can be supported
How to Estimate Carbon Produced • 1 mg/L O2 = 0.375 mg Carbon • GPP = 2.6 mg O2/L/hr * 0.375 = 0.975 mg C/L/hr • NPP = 1.5 mg O2/L/hr * 0.375 = 0.563 mg C/L/hr • For this example, 0.563 mg of carbon per liter of water per hour are added as biomass to the system
Estimated NPP Units = petagrams of carbon; 1 petagram = 1015 grams = 109 metric tons
Low High Worldwide Production
Ocean Productivity • On a per square meter basis the oceans are about as productive as the arctic tundra • Sometimes called a biological desert • However, because the ocean’s make up 71% of the Earth’s surface, they account for 46% of total productivity
Energy fixed by primary production* Energy input per unit area per unit time Efficiency of GPP = X 100 Photosynthetic Efficiency • Percentage of received solar energy a plant uses: *Calculate number of carbon atoms from plant weight. Can then calculate the amount of energy required to build the plant.
= 0.42% 20,991 kJ/m2/yr gross primary production 4,973,604 kJ incident sunlight Efficiency of GPP = X 100 Efficiency of Lake Mendota, Wisconsin
dldt = kl Limiting Factors – Aquatic Communities • Depth of light penetration determines the photic zone: Where: l = amount of solar radiation (joules per m2 per unit of time) t = depth k = extinction coefficient • Typically, more than half of the solar radiation is absorbed in the first meter of water:
Attenuation of Solar Radiation Coastal seawater ~k=0.3 Mississippi River? -Turbulence Pure water Oceanic seawater
Lake Classification Based on Production • Eutrophic – high production but little light penetration • Oligotrophic – low production but high light penetration
Rate of Photosynthesis Measured as grams of carbon fixed per m2 Eutrophic Intermediate Oligotrophic Note the scale
Marine Communities North Pacific Gyre Euphotic Zone – the surface down to 1% light level Nutrient Limited?
Why are the Ocean’s so Unproductive? P – High; N – Low Nitrogen, not phosphorous, is limiting Surprising because of the ability of cyanobacteria to fix atmospheric nitrogen?
What else? • Top down control – Predation (by herbivores) is actually limiting the phytoplankton population • Nutrients phytoplankton zooplankton fish • Herbivory limits phytoplankton • Bottom up control – Some other nutrient than nitrogen or phosphorous may be limiting • Nutrients phytoplankton zooplankton fish • Nutrients limit phytoplankton
Sargasso Sea • Found not to be N or P limited, but Iron limited
Why Iron • Cyanobacteria fix atmospheric nitrogen to a form available to phytoplankton • Iron is necessary for this process: Iron cyanobacteria N fixation phytoplankton
Nutrient Addition:303 studies combined Silica important when community dominated by diatoms
Freshwater Production Limits • Solar radiation usually limits primary production in a given freshwater lake on a day to day basis • Temperature is highly correlated to solar radiation, so it is hard to tease out specific temperature effects • Plants require nitrogen, calcium, phosphorous, potassium, sulfur, chlorine, sodium, magnesium, iron, manganese, copper, iodine, cobalt, zinc, boron, vanadium, and molybdenum • Any one of these could be limiting in a freshwater lake, but is usually nitrogen and/or phosphorous • Ocean water usually has a constant amount of these nutrients
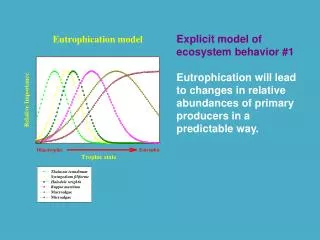
Eutrophication • Eutrophication – increase in phytoplankton density due to anthropogenic increases in nutrients • Usually shift from a diatom or green algae dominated community to a blue-green algae dominated community • To control eutrophication, you must control nutrient source • Sewerage or runoff
Blue-green Algae Negative • Can become very abundant when nutrients are abundant and form a floating ‘scum’ • Zooplankton do not graze as heavily on blue-green algae • Can fix their own N when it is limiting • Low nutrient food item for zooplankton
Limited by Phosphorous Phosphorous is limiting in this system, not nitrogen
More Phosphorous Chlorophyll a increases as phosphorous increases Nitrogen-to-phosphorous ratio can regulate the phytoplankton community; nitrogen limited
Aquatic Summary • Phytoplankton dominates primary production • Ocean primary production is nitrogen limited • Indirectly iron limited • Overall, ocean productivity is low • Freshwater lake primary production is phosphorous limited • But can be limited by other nutrients • FW lake productivity can vary from highly oligotrophic to highly eutrophic
Terrestrial Limits to Primary Production • Solar Radiation • Equator to poles • Temperature • Tropical mountains • Rainfall • Nutrients • Nitrogen, phosphorous
(a) June 1988 – August 1998 Using satellite imagery to estimate global primary production
Low High Latitude & Solar Radiation
Evapotranspiration • Evapotranspiration – the amount of water pumped into the atmosphere by evaporation from the ground and via transpiration from vegetation • A measure of solar radiation, temperature and rainfall Can be used to predict above ground NPP
Vegetation Type • Leaf – area index – The greater the surface area the greater amount of photosynthesis • Conifers (pine trees) have a higher leaf-area index than deciduous trees (oak trees) • Conifers keep their leaves much longer, thus they have a longer growing season Cool Temperate Zone Warm Temperate Zone
Leaf Area Duration Leaf-area index times length of growing season (determined by temperature) in months. Accurately predicts GPP. Broadleaves Needle - leaves Another value used to describe temperature over time is degree day: the sum of daily average temperatures for a specific period.