CHAPTER 54 ECOSYSTEMS
CHAPTER 54 ECOSYSTEMS. -THE ECOSYSTEM APPROACH TO ECOLOGY. -PRIMARY PRODUCTION IN ECOSYSTEMS. -SECONDARY PRODUCTION IN ECOSYSTEMS. -THE CYCLING OF CHEMICAL ELEMENTS IN ECOSYSTEMS. -HUMAN IMPACT ON ECOSYSTEMS AND THE BIOSPHERE.

CHAPTER 54 ECOSYSTEMS
E N D
Presentation Transcript
CHAPTER 54ECOSYSTEMS -THE ECOSYSTEM APPROACH TO ECOLOGY -PRIMARY PRODUCTION IN ECOSYSTEMS -SECONDARY PRODUCTION IN ECOSYSTEMS -THE CYCLING OF CHEMICAL ELEMENTS IN ECOSYSTEMS -HUMAN IMPACT ON ECOSYSTEMS AND THE BIOSPHERE
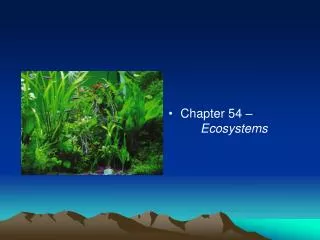
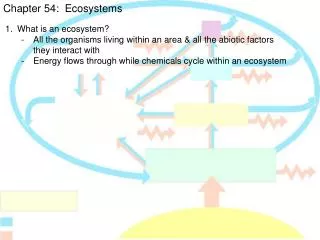
An ecosystem consists of all the organisms living in a community as well as all the abiotic factors with which they interact. As with populations and communities, the boundaries of ecosystems are usually not discrete. Ecosystems can range from a microcosm, such as the terrarium you see here, to lakes and forests. Many ecologists regard the entire biosphere as a global ecosystem, a composite of all the local ecosystems on Earth. The biosphere, or whole-earth ecosystem, is the most inclusive level in the hierarchy of biological organization. The dynamics of an ecosystem involve two processes that cannot be fully described at lower organizational levels: energy flow and chemical cycling. Energy enters most ecosystems in the form of sunlight. It is then converted to chemical energy by autotrophic organisms, passed to heterotrophs in the organic compounds of food, and dissipated in the form of heat. Chemical elements such as carbon and nitrogen are cycled between abiotic and biotic components of the ecosystem. Photosynthetic organisms assimilate these elements in inorganic form from the air, soil, and water and incorporate them into organic molecules, some of which are consumed by animals. The elements are returned in inorganic form to the air, soil, and water by the metabolism of plants and animals and by other organisms, such as bacteria and fungi, that break down organic wastes and dead organisms. The movements of energy and matter through ecosystems are related because both occur by the transfer of substances through photosynthesis and feeding relationships. However, because energy, unlike matter, cannot be recycled, an ecosystem must be powered by a continuous influx of new energy from an external source (the sun). Energy flows through ecosystems, while matter cycles within them . This chapter describes the dynamics of energy flow and chemical cycling in ecosystems and considers some of the consequences of human intrusions into these processes .
THE ECOSYSTEM APPROACH TO ECOLOGY Ecosystem ecologists view ecosystems as energy machines and matter processors. By grouping the species in a community into trophic levels of feeding relationships, we can follow the transformation of energy in the whole ecosystem and map the movements of chemical elements as they are used by the biotic community. As we discussed in Chapter 53, ecologists divide species into trophic levels on the basis of their main source of nutrition and energy.
Trophic relationships determine the routes of energy flow and chemical cycling in an ecosystem The trophic level that ultimately supports all others in an ecosystem consists of autotrophs, the primary producers of the ecosystem. Most autotrophs are photosynthetic organisms that use light energy to synthesize sugars and other organic compounds, which they then use as fuel for cellular respiration and as building material for growth. Plants, algae, and photosynthetic prokaryotes are the biosphere’s main autotrophs, although chemoautotrophic prokaryotes are the primary producers in certain ecosystems, such as deep-sea hydrothermal vents.
Organisms in trophic levels above the primary producers are heterotrophs, which directly or indirectly depend on the photosynthetic output of primary producers. Herbivores, which eat primary producers (plants or algae), are the primary consumers. Carnivores that eat herbivores are secondary consumers, and carnivores that eat other carnivores are tertiary consumers. Another important group of heterotrophs consists of the detritivores. Detritivores, or decomposers, are consumers that get their energy from detritus, which is nonliving organic material, such as the remains of dead organisms, feces, fallen leaves, and wood. Decomposers play a central role in material cycling. An overview of ecosystem dynamics. This generalized scheme traces energy flow (broken red lines) and material cycling (solid blue lines) in ecosystems. Energy flow starts from the sun as solar radiation, moves as chemical energy transfers in the food web, and finishes as heat radiated into space. Materials flow through the trophic levels eventually to detritus and then cycle back to the primary producers.
Decomposition connects all trophic levels The fungi, bacteria, invertebrates, and vertebrates that feed as detritivores often form a major link between the primary producers and the consumers in an ecosystem. In streams, for example, much of the organic material that is used by consumers is supplied by terrestrial plants and enters the ecosystem as leaves and other debris that fall into the water or are washed in by runoff. A crayfish might feed on this plant detritus and associated bacteria and fungi at the bottom of a stream and then be eaten by a fish. In a forest, birds might feed on earthworms that have been feeding on leaf litter and its associated bacteria and fungi in the soil. But even more important than this channeling of resources from producers to consumers is the role that detritivores play in making vital chemical elements available to producers.
The organic material that makes up the living organisms in an ecosystem gets recycled. Detritivores break down (decompose) the organic material and recycle the chemical elements in inorganic forms to abiotic reservoirs such as soil, water, and air. Plants and other producers can then reassimilate these elements into organic matter. All organisms perform some decomposition, breaking down organic molecules during cellular respiration, for example. But an ecosystem’s main decomposers are prokaryotes and fungi, which secrete enzymes that digest organic material and then absorb the breakdown products. Accounting for most of the conversion of organic materials from all trophic levels into inorganic compounds usable by autotrophs, decomposition by prokaryotes and fungi links all trophic levels. Decomposition is the most unappreciated of all ecological processes because prokaryotes and most fungi are not readily visible to the human eye. Yet if decomposition stopped, all life on Earth would cease. The interconnectedness of trophic levels is one of ecosystem ecology’s important lessons. Fungi decomposing a log.
The laws of physics and chemistry apply to ecosystems Much of an ecologist’s analysis of ecosystem dynamics comes from well-established laws of physics and chemistry. The law of conservation of energy states that energy cannot be created or destroyed but only transformed. This means that for all ecosystems, we can potentially trace energy exactly from its input as solar radiation to its release as heat from organisms. Plants and other photosynthetic organisms convert solar energy to chemical energy, but the total amount of energy does not change. The total amount of energy stored in organic molecules plus the amount reflected and dissipated as heat must equal the total incident energy in the form of sunlight. One important objective of ecosystem ecology is to compute such energy budgets and trace the energy flow in particular ecosystems.
The second law of thermodynamics tells us that energy conversions cannot be completely efficient--that some energy will be lost; as heat in any conversion process (see Chapter 6). This idea suggests that we can measure the efficiency of ecological energy conversions in the same way we measure the efficiency of light bulbs and car engines. While energy in ecosystems is dissipated ultimately as heat into outer space, chemical elements are continually recycled. A unit of energy moves through the trophic structure of an ecosystem only once, and without the sun providing continuous energy to Earth, ecosystems would vanish. In contrast, a carbon or nitrogen atom moves from trophic level to trophic level and eventually to the decomposers and then back again in endless cycles. Elements are not lost on a global scale, although they may move out of one ecosystem and into another. The measurement and analysis of these cycles of chemical elements in ecosystems and in the entire biosphere are an important part of ecosystem ecology. Now that we have considered energy flow and material cycling in the context of trophic structures, let’s take a closer look at these dynamics, beginning with the producers.
PRIMARY PRODUCTION IN ECOSYSTEMS The amount of light energy converted to chemical energy (organic compounds) by an ecosystem’s autotrophs during a given time period is called primary production. This photosynthetic product is the starting point for studies of ecosystem metabolism and energy flow.
An ecosystem’s energy budget depends on primary production Most primary producers use light energy to synthesize energy-rich organic molecules, which can subsequently be broken down to generate ATP. Consumers acquire their organic fuels secondhand (or even third- or fourthhand) through food webs. Therefore, the extent of photosynthetic production sets the spending limit for the energy budget of the entire ecosystem.
The Global Energy Budget Every day, Earth is bombarded by about 1022 joules of solar radiation (1 J = 0.239 cal). This is the energy equivalent of 100 million atomic bombs. As described in Chapter 50, the intensity of the solar energy striking Earth and its atmosphere varies with latitude, with the tropics receiving the highest input. Most solar radiation is absorbed, scattered, or reflected by the atmosphere in an asymmetrical pattern determined by variations in cloud cover and the quantity of dust in the air over different regions. The amount of solar radiation reaching the surface of the globe ultimately limits the photosynthetic output of ecosystems.
Much of the solar radiation that reaches the biosphere lands on bare ground and bodies of water that either absorb or reflect the incoming energy. Only a small fraction actually strikes algae, photosynthetic prokaryotes, and plant leaves, and only some of this is of wavelengths suitable for photosynthesis. Of the visible light that does reach photosynthetic organisms, only about 1% is converted to chemical energy by photosynthesis, and this efficiency varies with the type of organism, light level, and other factors. Although the fraction of the total incoming solar radiation that is ultimately trapped by photosynthesis is very small, primary producers on Earth collectively create about 170 billion tons of organic material per year--an impressive quantity.
Gross and Net Primary Production Total primary production is known as gross primary production (GPP)--the amount of light energy that is converted to chemical energy by photosynthesis per unit time. Not all of this production is stored as organic material in the growing plants, because the plants use some of the molecules as fuel in their own cellular respiration. Net primary production (NPP) is equal to gross primary production minus the energy used by the primary producers for respiration (R): Net primary production is the measurement of greatest interest to ecologists because it represents the storage of chemical energy that will be available to consumers in an ecosystem. In forests, net production may be as little as one-fourth that of gross production. Trees have larger masses of stems, branches, and roots to support through respiration than do herbs; thus, less energy is lost to respiration in herbaceous and crop communities than in forests.
Primary production can be expressed in terms of energy per unit area per unit time (J/m2/yr) or as biomass (weight) of vegetation added to the ecosystem per unit area per unit time (g/m2/yr). Biomass is usually expressed in terms of the dry weight of organic material because water molecules contain no usable energy and because the water content of plants varies over short periods of time. An ecosystem’s primary production should not be confused with the total biomass of photosynthetic autotrophs present at a given time, called the standing crop. Primary production is the amount of new biomass added in a given period of time. Although a forest has a very large standing crop biomass, its primary production may actually be less than that of some grasslands, which do not accumulate vegetation because animals consume the plants rapidly and because some of the plants are annuals.
Different ecosystems vary considerably in their production as well as in their contribution to the total production on Earth. Tropical rain forests are among the most productive terrestrial ecosystems, and because they cover a large portion of Earth, they contribute a large proportion of the planet’s overall production. Estuaries and coral reefs also have very high production, but their total contribution to global production is relatively small because these ecosystems are not very extensive. The open ocean contributes more primary production than any other ecosystem, but this is because of its very large size; production per unit area is relatively low. Deserts and tundra also have low production. Primary production of different ecosystems. (a) The geographic extent and (b) the production per unit area of different ecosystems determine their total contribution to (c) worldwide primary production. Open ocean, for example, contributes a lot to the planet’s production despite its low production per unit area because of its large size, whereas tropical rain forest contributes a lot because of its high production. (Aquatic ecosystems are color-coded blue in these histographs; terrestrial ecosystems are green.)
Satellite images of the globe now provide a means of studying global patterns of primary production. The most striking impression from these global satellite maps is how unproductive most of the oceans are, in contrast to the high production of tropical forest regions. Regional annual net primary production for Earth. The image is based on data, such as chlorophyll density, collected by satellites. The values on the color key are grams of carbon per square meter per year. Ocean data are averages from 1978 to 1983. Land averages are from 1982 to 1990. Of total global primary production, the ocean contributes 46% and the land 54% .
In aquatic ecosystems, light and nutrients limit primary production What controls primary production in ecosystems? To ask this question another way, what factors could we change to increase or decrease primary production for a given ecosystem? We will look first at the factors that limit production in aquatic ecosystems, beginning with marine ecosystems.
Production in Marine Ecosystems Light is the first variable one might expect to control primary production in oceans, since solar radiation drives photosynthesis. The depth to which light penetrates the ocean affects primary production throughout the photic zone. More than half of the solar radiation is absorbed in the first meter of water. Even in "clear" water, only 5-10% of the radiation may reach a depth of 20 m.
If light is the primary variable limiting primary production in the ocean, we would expect production to increase along a gradient from the poles toward the equator, which receives the greatest intensity of light (see figure below). However, you can see that there is no such gradient by reexamining the figure below (right). Some parts of the tropics and subtropics, such as the Sargasso Sea, the Indian Ocean, and the central part of the North Pacific, are very unproductive. In contrast, the North Atlantic, the Gulf of Alaska, and the Southern Ocean off New Zealand are relatively productive areas.
Why are tropical oceans less productive than we would expect from their high year-round intensity of illumination? It is actually nutrients more than light that limit primary production in different geographic regions of the ocean. Ecologists use the term limiting nutrient for the nutrient that must be added for production to increase. And two elements, nitrogen and phosphorus, are the nutrients that most often limit marine production. In the open ocean, nitrogen and phosphorus concentrations are very low in the photic (upper) zone, where phytoplankton live. Ironically, the nutrient supply is much better in deeper water, where it is too dark for photosynthesis. Vertical distribution of temperature, nutrients, and production in the upper layer of the central North Pacific during summer. The curves are composites of several vertical profiles made over a two-day period at a single location (28°N, 155°W). Chlorophyll is a measure of phytoplankton density. The broken line illustrates the depth of 1% of surface light (the traditional definition of the depth of the photic zone). Note that nitrate has been depleted to undetectable levels in the photic zone, but that most of the primary production (measured from 14C uptake) takes place in that nutrient-depleted zone because of the requirement for light.
Nitrogen is the one nutrient that limits phytoplankton growth in many parts of the ocean. The diagram below illustrates an experimental test of nitrogen versus phosphorus as the limiting factor for production in coastal waters off the south shore of Long Island, New York. Pollution from duck farms along the bays of Long Island adds both nitrogen and phosphorus to the coastal water; but unlike phosphorus, the nitrogen is immediately taken up by algae, and no trace of free nitrogen can be measured in the coastal waters. Nutrient enrichment experiments confirmed that nitrogen was limiting phytoplankton growth. The addition of nitrogen (in the form of ammonium) caused a heavy algal growth in bay water, but the addition of phosphate did not induce algal growth. There are some practical applications of this work, including the prevention of algal blooms caused by pollution that fertilizes the phytoplankton. If nitrogen is the factor now limiting phytoplankton production in the coastal zone, the elimination of phosphates from sewage will not help the problem of coastal pollution unless we first control nitrogen pollution. Experiments on nutrient limitations to phytoplankton production in coastal waters of Long Island.
Although nitrogen availability generally limits primary production in marine ecosystems, there are some anomalies. Several large areas of the ocean have low phytoplankton densities in spite of relatively high nitrogen concentrations. For example, in the Sargasso Sea, a subtropical region of the Atlantic Ocean, the water is among the most transparent in the world because of a very low density of phytoplankton. When researchers conducted a series of nutrient enrichment experiments, they found that it was availability of the micronutrient iron that limited primary production, not nitrogen or phosphorus.
Evidence that iron limits production in some oceanic ecosystems encouraged marine ecologists to try two large-scale field experiments in the tropical Pacific in 1993 and 1995. The researchers spread low concentrations of dissolved iron over 72 km2 of ocean and then measured the change in phytoplankton density over a seven-day period. A massive phytoplankton bloom occurred, as indicated by a 27-fold increase in chlorophyll concentration in water samples from the test sites. Why are iron concentrations naturally low in certain oceanic regions? Windblown dust from the land is the main process delivering iron to the ocean, and relatively little dust reaches the central Pacific and central Atlantic Oceans. The iron factor in marine ecosystems is actually related to the nitrogen factor. Where iron is limiting, additions stimulate growth of cyanobacteria that fix nitrogen, converting atmospheric N2 to nitrogenous minerals. These nitrogenous nutrients in turn stimulate proliferation of eukaryotic phytoplankton: A phytoplankton bloom swirls in the waters off islands in southeast Alaska. Nutrients such as iron encourage the tiny marine plants to grow. Studies show the plankton, like trees, remove carbon dioxide gas from the atmosphere, and so could serve as natural carbon sinks.
Areas of upwelling in the ocean are the main exceptions to primary production being limited by nutrients. The largest area of upwelling occurs in the Antarctic Ocean, where nutrient-rich deep waters circulate to the surface near the Antarctic continent. Other areas of upwelling are the coastal waters off Peru and California. Because the steady supply of nutrients stimulates phytoplankton production at the base of food webs, areas of upwelling are prime fishing locations.
Marine ecologists are just beginning to piece together the interplay of factors that determine primary production in the oceans. One of the most important technical breakthroughs is the remote sensing of primary production data collected by satellites. Remote sensing of primary production in oceans. This 1995 satellite image maps locations of high primary production in the Pacific region around Vancouver Island, British Columbia. A spectral instrument estimates chlorophyll concentrations in surface waters and converts the data to contrasting artificial colors. The areas that are green, red, or white in the color-enhanced photo are the richest in chlorophyll and hence phytoplankton. Note the phytoplankton bloom off the west coast of Vancouver Island. The second big bloom, in the sound between the island and the mainland, is due to a plume of nutrient-rich water from the Fraser River.
Production in Freshwater Ecosystems Solar radiation limits primary production on a day-to-day basis in lakes, and within any given lake, you can predict the daily primary production from the solar radiation for that day. Temperature is closely linked with light intensity in freshwater systems and is difficult to evaluate as a separate factor. Nutrient limitations are also common in freshwater lakes. During the 1970s, interest in what controls primary production in freshwater lakes became associated with the environmental issue of increasing water pollution. Sewage and fertilizer runoff from farms and yards added nutrients to lakes. This shifted many lakes from having phytoplankton communities dominated by diatoms or green algae to having phytoplankton communities dominated by cyanobacteria. This process, eutrophication, has generally undesirable impacts from a human perspective, including the eventual loss of fish from lakes.
Controlling eutrophication requires knowing which polluting nutrient enables the cyanobacteria to bloom. Unlike the situation in marine ecosystems, nitrogen is rarely the limiting factor for primary production in lakes. In the 1970s, David Schindler, whom you met in the interview on p. 1190, conducted a series of whole-lake experiments that pointed to phosphorus as the limiting nutrient that stimulated the cyanobacterial blooms. His research led to the use of phosphate-free detergents and other water quality reforms. The experimental eutrophication of a lake. The far basin of this lake was separated from the near basin by a plastic curtain and fertilized with inorganic sources of carbon, nitrogen, and phosphorus. Within two months, the fertilized basin was covered with a cyanobacterial bloom, which appears white in the photograph. The near basin, which was treated with only carbon and nitrogen, remained unchanged. In this case, phosphorus was the key limiting nutrient, and its addition stimulated the explosive growth of cyanobacteria.
In terrestrial ecosystems, temperature, moisture, and nutrients limit primary production Of course, water availability varies more among terrestrial ecosystems than among aquatic ones, but terrestrial ecosystems also vary more in temperature. On a large geographic scale, temperature and moisture are the key factors controlling primary production in ecosystems. Note again in the figure below that tropical rain forests, with their warm, wet conditions that promote plant growth, are the most productive of all terrestrial ecosystems.
On a more local scale, mineral nutrients in the soil can play key roles in limiting primary production in terrestrial ecosystems. Primary production removes soil nutrients, sometimes faster than they are replaced. At some point, a nutrient deficiency may cause plant growth to slow or cease. It is unlikely that all nutrients will be exhausted simultaneously. If a limiting nutrient controls production, adding a nonlimiting nutrient to the soil will not stimulate production. For example, if nitrogen is limiting, then adding phosphorus, even if it, too, is in relatively short supply, will not stimulate production. But if we add nitrogen, this will stimulate plant growth until some other nutrient--say, phosphorus--becomes limiting. In fact, either nitrogen or phosphorus is the soil nutrient that most commonly limits terrestrial production. Scientific studies relating nutrients to production have practical applications in agriculture. Farmers maximize their crop yields by using fertilizers with the right balance of nutrients for the local soil and the type of crop. Nutrient addition experiments in a Hudson Bay salt marsh. Note that experimental plots receiving phosphorus (P) alone do not outproduce the unfertilized control plots. But adding nitrogen (N) boosts production. Nitrogen is the limiting nutrient, at least until late summer. At this point, phosphorus may become limiting. (What is the basis for this inference?)
SECONDARY PRODUCTION IN ECOSYSTEMS The amount of chemical energy in consumers’ food that is converted to their own new biomass during a given time period is called the secondary production of the ecosystem. Consider the transfer of organic matter from producers to herbivores, the primary consumers. In most ecosystems, herbivores manage to eat only a small fraction of the plant material produced. And they cannot digest all the plant material that they do eat, as anyone who has walked through a dairy farm will attest. Thus, much of primary production is not used by consumers. Let us analyze this process of energy transfer more closely.
The efficiency of energy transfer between trophic levels is usually less than 20% Production Efficiency One way to start thinking about secondary production is to examine the process in individual organisms. Caterpillars feed on plant leaves, and the figure below is a simplified diagram of how the energy a caterpillar obtains from food is partitioned. Out of 200 J (48 cal) consumed by a caterpillar, only about 33 J (one-sixth) is used for growth. The caterpillar passes the rest as feces or uses it for cellular respiration. The energy contained in the feces is not lost from the ecosystem, as it will be consumed by detritivores. However, the energy used for respiration is lost from the ecosystem as heat. Energy pours into an ecosystem as solar radiation and drains away as respiratory heat loss. This is why energy is said to flow through, not cycle within, ecosystems. Only the chemical energy stored as growth (or the production of offspring) by herbivores is available as food to secondary consumers. And our example actually overestimates the conversion of primary production to secondary production because we did not account for all the plant material that herbivores do not even consume. The greenness of terrestrial landscapes due to an abundance of plant material indicates that most net primary production is not converted over the short term to secondary production. Energy partitioning within a link of the food chain. Less than 17% of the caterpillar’s food is actually converted to caterpillar biomass.
If we view animals as energy transformers, we can ask questions about their relative efficiencies. This is the efficiency measure we’ll use: Net secondary production is the energy stored in biomass represented by growth and reproduction. Assimilation consists of the total energy taken in and used for growth, reproduction, and respiration. In other words, production efficiency is the fraction of food energy that is not used for respiration. For the caterpillar in the diagram below, production efficiency is 33% ; 67 J of the 100 J of assimilated energy is used for respiration (note that energy lost as undigestible material in feces does not count as assimilation). Birds and mammals have low production efficiencies, ranging from 1-3% , because they use so much energy to maintain a warm body temperature. Fishes, which are ectotherms (“cold blooded”), have a production efficiency around 10% . Insects are even more efficient, with production efficiencies averaging 40% .
Trophic Efficiency and Ecological Pyramids Let’s scale up now from the production efficiencies of individual consumers to the flow of energy through whole trophic levels. Trophic efficiency is the percentage of production transferred from one trophic level to the next. Put another way, trophic efficiency is the fraction of net production at one trophic level as a percent of net production at the level below. Trophic efficiencies must always be less than production efficiencies because they take into account not only the energy lost through respiration and materials in feces, but also the energy in organic material in a lower trophic level that is not consumed by the next trophic level. Trophic efficiencies usually range from 5-20% , depending on the type of ecosystem. In other words, 80-95% of the energy available at one trophic level never transfers to the next. And this loss is multiplied over the length of a food chain. If 10% of energy is transferred from primary producers to primary consumers, and 10% of that energy is transferred to secondary consumers, then only 1% of net primary production is available to secondary consumers (10% of 10% ).
Pyramids of Production. This multiplicative loss of energy from a food chain can be represented by a pyramid of production, in which the trophic levels are stacked in blocks, with primary producers forming the foundation of the pyramid. The size of each block is proportional to the production of each trophic level. An idealized pyramid of net production. This example is based on a trophic efficiency of 10% for each link in the food chain. Notice that primary producers convert only about 1% of the energy in the sunlight available to them into net primary production.
Pyramids of Biomass. One important ecological consequence of low trophic efficiencies can be represented in a biomass pyramid, in which each tier represents the standing crop (the total dry weight of all organisms) in a trophic level. Most biomass pyramids narrow sharply from primary producers at the base to top-level carnivores at the apex because energy transfers between trophic levels are so inefficient (FIGURE a). Some aquatic ecosystems, however, have inverted biomass pyramids, with primary consumers outweighing producers. In the waters of the English Channel, for example, the biomass of zooplankton (consumers) is five times the weight of phytoplankton (producers) (FIGURE b). Such inverted biomass pyramids occur because the zooplankton consume the phytoplankton so quickly that the producers never develop a large population size, or standing crop. Instead, the phytoplankton grow, reproduce, and are consumed rapidly. Phytoplankton have a short turnover time, which means they have a small standing crop biomass compared to their production: Because the phytoplankton continue to replace their biomass at such a rapid rate, they can support a biomass of zooplankton bigger than their own biomass. Nevertheless, the pyramid of production for this ecosystem is upright, because phytoplankton have a much higher production than zooplankton. Pyramids of biomass (standing crop). Numbers denote the dry weight (g/m2) for all organisms at a trophic level.
Pyramids of Numbers. The multiplicative loss of energy from food chains severely limits the overall biomass of top-level carnivores that any ecosystem can support. Only about one one-thousandth of the chemical energy fixed by photosynthesis can flow all the way through a food web to a tertiary consumer, such as a hawk, snake, or shark. This explains why food webs usually include only about four or five trophic levels.
Because predators are usually larger than the prey they eat, top-level predators tend to be fairly large animals. Thus, the limited biomass at the top of an ecological pyramid is concentrated in a relatively small number of large individuals. This phenomenon is reflected in a pyramid of numbers, in which the size of each block is proportional to the number of individual organisms present in each trophic level. Populations of top predators are typically small, and the animals may be widely spaced within their habitats. As a result, many predators are highly susceptible to extinction. A pyramid of numbers. In this pyramid of numbers for a bluegrass field in Michigan, only three top carnivores are supported in an ecosystem based on production by nearly 6 million plants.
The dynamics of energy flow through ecosystems have important implications for the human population. Eating meat is a relatively inefficient way of tapping photosynthetic production. A human obtains far more calories by eating grains directly as a primary consumer than by processing that same amount of grain through another trophic level and eating grain-fed animals (beef, chicken, pork, lamb, farm fish). Worldwide agriculture could, in fact, successfully feed many more people than it does today if we all consumed only plant material, feeding more efficiently as primary consumers. Food energy available to the human population at different trophic levels. Most humans have a diet between these two extremes.
Herbivores consume a small percentage of vegetation: the green world hypothesis With so many primary consumers (herbivores) munching away on plants, how can we explain why most terrestrial ecosystems are actually quite green, boosting large standing crops of vegetation? According to the green world hypothesis, herbivores consume relatively little plant biomass because they are held in check by a variety of factors, including predators, parasites, and disease. Let’s look at some of the numbers that account for a green world. There is a total of about 83 X 1010 metric tons of carbon stored in the plant biomass of terrestrial ecosystems. And the global rate of terrestrial primary production is about 5 X 10¹⁰ metric tons of plant biomass per year. (If you return to the equation on p. 1207, you can now calculate the global turnover rate for Earth’s vegetation.) On a global scale, herbivores consume less than 17% of the total net annual production by plants. Thus, in general, herbivores are only a minor nuisance to plants. We do know that some herbivores have the potential to completely strip local vegetation over the short term; an example is the occasional ability of exploding gypsy moth populations to defoliate areas of forest in the northeastern United States. Such exceptions only heighten our curiosity about why Earth is so green.
The green world hypothesis proposes several factors that keep herbivores in check: Plants have defenses against herbivores . These defenses include noxious chemicals. Nutrients, not energy supply, usually limit herbivores . Animals need certain nutrients, such as organic nitrogen (protein), that plants often supply in relatively small amounts. Even in a world of plentiful green energy, the growth and reproduction of many herbivores is limited by availability of essential nutrients, not by energy (calories). Abiotic factors limit herbivores . Unfavorable seasonal changes in temperature and moisture are examples of abiotic factors that can set a carrying capacity for herbivores far below the number that would strip vegetation. Intraspecific competition can limit herbivore numbers . Territorial behavior and other consequences of competition may maintain herbivores’ population densities below what the vegetation could support with food. Interspecific interactions check herbivore densities . The green world hypothesis postulates that predators, parasites, and disease are the most important factors limiting the growth of herbivore populations. This applies the top-down model of community structure. The relationship of herbivores to plants emphasizes the importance of trophic structure for understanding the dynamics of an ecosystem. We now redirect our focus from energy flow to the cycling of nutrients in ecosystems.
THE CYCLING OF CHEMICAL ELEMENTS IN ECOSYSTEMS Although ecosystems receive an essentially inexhaustible influx of solar energy, chemical elements are available only in limited amounts. (The meteorites that occasionally strike Earth are the only extraterrestrial source of matter.) Life on Earth therefore depends on the recycling of essential chemical elements. Even while an individual organism is alive, much of its chemical stock is rotated continuously as nutrients are assimilated and waste products released. Atoms present in the complex molecules of an organism at its time of death are returned as simpler compounds to the atmosphere, water, or soil by the action of decomposers. This decomposition replenishes the pools of inorganic nutrients that plants and other autotrophs use to build new organic matter. Because nutrient circuits involve both biotic and abiotic components of ecosystems, they are also called biogeochemical cycles.
Biological and geologic processes move nutrients between organic and inorganic compartments A chemical’s specific route through a biogeochemical cycle varies with the particular element and the trophic structure of the ecosystem. We can, however, recognize two general categories of biogeochemical cycles. Gaseous forms of carbon, oxygen, sulfur, and nitrogen occur in the atmosphere, and cycles of these elements are essentially global. For example, some of the carbon and oxygen atoms a plant acquires from the air as CO2 may have been released into the atmosphere by the respiration of a plant or animal in some distant locale. Other elements that are less mobile in the environment, including phosphorus, potassium, calcium, and the trace elements, generally cycle on a more localized scale, at least over the short term. Soil is the main abiotic reservoir of these elements, which are absorbed by plant roots and eventually returned to the soil by decomposers, usually in the same general vicinity.
A General Model of Chemical Cycling Before examining the details of individual cycles, let’s look at a general model of nutrient cycling that shows the main reservoirs, or compartments, of elements and the processes that transfer elements between reservoir. Most nutrients accumulate in four reservoirs, each of which is defined by two characteristics: whether it contains organic or inorganic materials and whether or not the materials are directly available for use by organisms. One compartment of organic materials is composed of the living organisms themselves and detritus; these nutrients are available to other organisms when consumers feed and when detritivores consume nonliving organic matter. The second organic compartment includes "fossilized" deposits of once-living organisms (coal, oil, and peat), from which nutrients cannot be assimilated directly. Material moved from the living organic compartment to the fossilized organic compartment long ago, when organisms died and were buried by sedimentation over millions of years to become coal, oil, or peat. A general model of nutrient cycling. The biological and geologic processes that move nutrients from one compartment reservoir to another are indicated on the arrows.
Nutrients also occur in two inorganic compartments, one in which they are available for use by organisms and one in which they are not. The available inorganic compartment includes matter (elements and compounds) that is dissolved in water or present in soil or air. Organisms assimilate materials from this compartment directly and return chemicals to it through the fairly rapid processes of cellular respiration, excretion, and decomposition. Elements in the unavailable inorganic compartment are tied up in rocks. Although organisms cannot tap into this compartment directly, nutrients slowly become available through weathering and erosion. Similarly, unavailable organic materials move into the available compartment of inorganic nutrients through erosion or when fossil fuels are burned and the exhaust enters the atmosphere.
Describing biogeochemical cycles in general is much simpler than actually tracing elements through these cycles, especially since ecosystems exchange elements with other ecosystems. Even in a pond, which has discrete boundaries, several processes add and remove key nutrients. Minerals dissolved in rainwater or runoff from the neighboring land are added to the pond, as are nutrient-rich pollen, fallen leaves, and other airborne material. And of course, carbon, oxygen, and nitrogen cycle between the pond and the atmosphere. Birds may feed on fish or the aquatic larvae of insects, which derived their store of nutrients from the pond, and some of those nutrients may then be excreted or eliminated on land far from the pond’s drainage area. Keeping track of the inflow and outflow is even more challenging in less clearly delineated terrestrial ecosystems. Nevertheless, ecologists have worked out the schemes for chemical cycling in several ecosystems, often by adding tiny amounts of radioactive tracers that enable the researchers to follow chemical elements through the various biotic and abiotic components of the ecosystems.
The Water Cycle One important cycle, the water cycle, does not fit the generalized scheme of the diagram on the left very well. Although organisms are mostly made of water, very little of the water that cycles through ecosystems is chemically altered by either the biotic or abiotic components. The main exception is the water that is split into hydrogen and oxygen during photosynthesis, but that involves a very tiny fraction of the total water passing through a plant or any other organism. The water cycle is more a physical process than a chemical one; it mainly involves changes between the liquid and gaseous states and the transport of the liquid water and water vapor. The water cycle. On a global scale, evaporation exceeds precipitation over the oceans. The result is a net movement of water vapor, carried by the winds, from the ocean to the land. The excess of precipitation over evaporation on land results in the formation of surface and groundwater systems that flow back to the sea, completing the major part of the cycle. Over the sea, evaporation forms most water vapor. On land, however, 90% or more of the vaporization is due to plant transpira-tion, which together with other types of evaporation is referred to as evapotranspiration. The numbers in this diagram indicate water flow in billion billion (1018) grams per year.
The Carbon Cycle Contrast the water cycle with the carbon cycle, which fits the generalized scheme of biogeochemical cycles much better. Now let’s take a closer look at two specific biogeochemical cycles: the nitrogen cycle and the phosphorus cycle. The carbon cycle. The reciprocal processes of photosynthesis and cellular respiration are responsible for the major transformations and movements of carbon. A seasonal pulse in atmospheric CO2 is caused by decreased photosynthetic activity during the Northern Hemisphere’s winter. On a global scale, the return of CO2 to the atmosphere by respiration closely balances its removal by photosynthesis. However, the burning of wood and fossil fuels adds more CO2 to the atmosphere; as a result, the amount of atmospheric CO2 is steadily increasing.
The Nitrogen Cycle Although Earth’s atmosphere is almost 80% nitrogen, it is mostly in the form of nitrogen gas (N2), which is unavailable to plants and hence to consumers of plants. Nitrogen enters ecosystems via two natural pathways, the relative importance of which varies greatly from ecosystem to ecosystem. The first, atmospheric deposition, accounts for approximately 5-10% of the usable nitrogen that enters most ecosystems. In this process, NH4+ and NO3-, the two forms of nitrogen available to plants, are added to soil by being dissolved in rain or by settling as part of fine dust or other particulates. Some plants, such as the epiphytic bromeliads found in the canopy of tropical rain forests, have aerial roots that can take up NH4+ and NO3- directly from the moist atmosphere. The nitrogen cycle. The addition of nitrogen from the atmosphere and its return via denitrification involve relatively small amounts compared to the local recycling that occurs in the soil or water. In some ecosystems, NH4+ and NO3- dissolved in rain add nitrogenous minerals to the soil (a process not included in this diagram).
The other natural pathway for nitrogen to enter ecosystems is via nitrogen fixation. Only certain prokaryotes can fix nitrogen--that is, convert N2 to minerals that can be used to synthesize nitrogenous organic compounds such as amino acids. Indeed, prokaryotes are vital links at several points in the nitrogen cycle. Nitrogen is fixed in terrestrial ecosystems by free-living (nonsymbiotic) soil bacteria as well as by symbiotic bacteria (Rhizobium) in the root nodules of legumes and certain other plants (see Chapter 37). Some cyanobacteria fix nitrogen in aquatic ecosystems. Organisms that fix nitrogen are, of course, fulfilling their own metabolic requirements, but the excess ammonia (NH3) they release becomes available to other organisms. In addition to these natural sources of usable nitrogen, industrial fixation of nitrogen for fertilizer now makes a major contribution to the pool of nitrogenous minerals in terrestrial and aquatic ecosystems.