Download
1 / 26
260 likes | 464 Vues
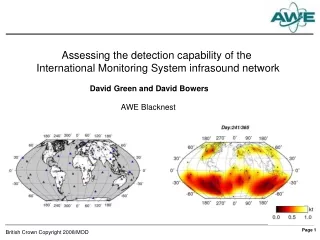
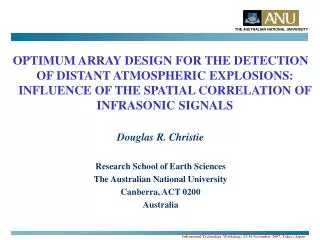
OPTIMUM ARRAY DESIGN FOR THE DETECTION OF DISTANT ATMOSPHERIC EXPLOSIONS: INFLUENCE OF THE SPATIAL CORRELATION OF INFRASONIC SIGNALS Douglas R. Christie Research School of Earth Sciences The Australian National University Canberra, ACT 0200 Australia. The Global Infrasound Monitoring Network.

E N D
OPTIMUM ARRAY DESIGN FOR THE DETECTION OF DISTANT ATMOSPHERIC EXPLOSIONS: INFLUENCE OF THE SPATIAL CORRELATION OF INFRASONIC SIGNALS Douglas R. Christie Research School of Earth Sciences The Australian National University Canberra, ACT 0200 Australia
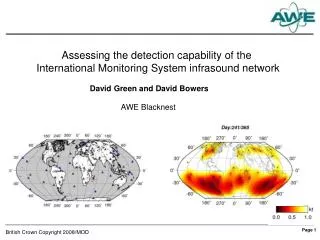
The Global Infrasound Monitoring Network • Average separation between nearest neighboring stations is 1970 km. • Some areas in the open oceans are located at more than 3000 km from any station. • Need reliable detection capability for explosions located at distances up to at least 4000 km. • 60-station network: 2-station detection capability for 1-kiloton explosion. • 4- to 15-element array stations in a variety of configurations with apertures between 1.0 and 3.0 km.
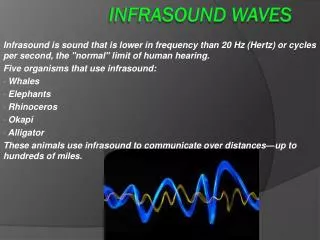
Reliable Detection of Infrasound from Regional and Distant Explosions Monitoring Passbands: a) Primary monitoring passband: 0.4 to 1.5 Hz. b)Long-period passband: 0.05 to 0.12 Hz. Required for detection of signals from distant explosions when wave propagation is restricted to a thermospheric waveguide. Potential Array Problems: a) Spatial aliasing of higher frequency signals. b) Signal correlation between array elements. Significant problem at higher frequencies. Automatic detection of infrasonic waves is usually based on correlation techniques.
Spatial Correlation of Signals from Atmospheric Explosions: Data Infrasonic signal data used in this investigation was recorded at IMS stations IS04, IS05 and IS07 located in Australia. Observations include signals from: • A very large number of open-cut mining explosions located at a variety of azimuths and distances ranging from 300 km to more than 2000 km; • Volcanic explosions; • Large bolide explosions; • Test chemical explosions at the Woomera Test Range.
Infrasound Array Stations and Explosion Sources in the Australian Region
Spatial Correlation of Infrasonic Signals • Array performance depends critically on signalcorrelation between array elements. Correlation needs to be included in array design. • Mack and Flinn (1971) coherence model provides a good fit to observations. Model assumes coherence losses are due to a small spread in phase velocity, c, and small spread in azimuth, . • Blandford (1997) found good fit at high frequencies to data from distant events with c = 15 m/s and = 5º. • Further studies have been reported by R. Shumway, D. McCormack and W. Armstrong.
Coherence of Infrasonic Signals at Long Periods (Mack and Flinn 1971) • Signal coherence depends on alignment of sensors with respect to the wavefront.
The Mack and Flinn Model Signal correlation predicted by the Mack and Flinn modelat a given frequency is given by (1) where T is period, cis the mean phase velocity, 2 is squared coherence and x and y are the components of the vector separation, r, of the infrasound sensors. This model accurately describes: • Decrease in correlation with increasing sensor separation; • Dependence of correlation on sensor pair orientation with respect to the wavefront; • Decrease in correlation with increasing frequency.
Variation of Correlation Between Two Sensors With Sensor Spacing and Frequency • Data agrees fairly well with Blandford’s parameters. • Upper correlation limit for sensors aligned normal to wavefront depends only on c. (Assuming c and small.) • Lower correlation limit for sensors aligned parallel to wavefront depends only on . (Assuming c and small.) • Correlation decreases rapidly with increasing frequency.
Azimuthal Variation of Correlation Between Two Sensors c = 15 m/s and = 5º • Sensors are aligned along the 0º (North) direction. • The azimuth is the angle between the wave propagation direction and the vector separation between the sensors. • Note the strong asymmetry in the correlation patterns at high frequency and large sensor separations
Array-Averaged Correlation Coefficients • The Mack and Flinn model can be used to calculate the azimuthal variation of the array-averaged correlation coefficient for any array configuration. • The use of the predicted array-averaged correlation coefficient has a number of advantages: • The array-averaged correlation coefficient provides a robust statistic for the direct comparison of model predictions with correlation observations for waves from any direction. • The predicted azimuthal variation of the array-averaged correlation coefficient provides a unique array characteristic that can be used as a measure of array performance. • Provides a measure of both azimuthal asymmetry and overall loss of signal correlation.
Array-Averaged CorrelationCoefficients Predicted by the Mack and Flinn Model Procedure: 1. Compute azimuthal variation of the correlation coefficient at a given frequency for each sensor pair in the array. 2. Rotate each of these distributions to the correct pair alignment in a common geographical coordinate system. 3. Average contributions from all sensor pairs to give the angular distribution of the array-averaged correlation coefficient for all wave back-azimuths. Calculation has been carried out for a variety of arrays including representative 8-element IMS arrays.
Predicted Array-Averaged Correlation Coefficients for 3-Component Sub-Arrays at IS07 • Azimuthal variation of the array correlation coefficient may be anisotropic at higher frequencies. • Regional and distant explosions may not be detected using correlation algorithms when arrays are large and sparse.
Correlation: Explosion-Generated Signals at IS07 0.5 Hz • Predicted correlation patterns agree fairly well with observations. • The lower correlations for Manam Volcano may reflect the nature of the source.
Correlation: Explosion-Generated Signals at IS07 1.0 Hz • Reasonable agreement with observations for small aperture array. • Results for larger arrays suggest that the Mack and Flinn parameters found by Blandford (1997) are slightly too restrictive.
Correlation: Explosion-Generated Signals at IS07 2.0 Hz • Predicted correlation patterns agree fairly well with observations. • Degree of correlation on large arrays is very small. • Correlation pattern of small array is isotropic, but attenuated.
Predicted Array Correlation Coefficients for a 0.5 x 1.5 km Rectangular Array • The array averaged correlation coefficient of rectangular arrays may be azimuthally dependent at frequencies in the primary monitoring passband.
Predicted Array Correlation Coefficients for 4-Element Symmetrical Centered Triangle Arrays • Array-averaged correlation coefficients for symmetrical triangular arrays are nearly azimuth independent. • Mack and Flinn model predictions suggest that the performance of these arrays at frequencies of 1.0 Hz and higher may be marginal, especially if the array aperture is 2 km or more.
8-Element Arrays: IS04, IS05 and IS07 Array Configuration and Response • All arrays have reasonably good side-lobe suppression
Predicted Array Correlation Coefficients for 8-Element Arrays • All arrays have reduced detection capability at 2.0 Hz, dominated by contributions from a small aperture sub-array. • Azimuth measurement accuracy is reduced. • Array correlation is anisotropic at 1.0 Hz for both IS04 and IS05. Array sensitivity depends on signal back-azimuth. • IS07 has the best configuration.
8- and 9-Element Pentagon Arrays Array Configuration and Response • Good side-lobe suppression
8-Element Pentagon Arrays • Array correlation is azimuth independent at all frequencies. • 2.0 and 3.0 km arrays have reduced detection capability at 2.0 Hz. Signal correlation is dominated at 2.0 Hz by contributions from the small aperture triangular sub-array. • 1.0-km array has good performance characteristics at 1.0 Hz • Optimum aperture of triangle sub-array is ~ 250 m.
9-Element Pentagon Arrays • Additional array element improves performance slightly. • 1.0-km array has best performance characteristics at high and low frequencies. • 9-element pentagon array will be more reliable than the 8-element pentagon array. • Optimum aperture of centered triangle sub-array is ~ 300 m.
Conclusions • Observations are in good general agreement with the predictions of the Mack and Flinn coherence model. • Arrays with good side-lobe suppression do not necessarily have good signal correlation properties. • Array-averaged correlation coefficient may exhibit significant azimuthal variation at frequencies in the monitoring passband. Arrays should be designed to be isotropic. • 8-element and 9-element pentagon arrays with an aperture of 1 km have good performance characteristics at 1.0 Hz. Triangle sub-array in 8-element arrays should have an aperture of about 250 m. Centered triangle in 9-element arrays should have an aperture of about 300 m.