Download
1 / 47
470 likes | 566 Vues
Learn about monitoring network behaviors, packet sniffing techniques, common sniffers, self-sniffing pitfalls, and legal considerations in network monitoring. Discover how to use Wireshark for packet analysis and gain insights into encryption challenges. This talk covers essential concepts and tools for admins and users. Understand the importance of disguising your needle in the digital haystack and explore the complexities of network packet sniffing across different network domains. Ensure you are monitoring securely and legally within the realm of network administration.

E N D
Alan Whinery U. Hawaii ITS Chief Internet Engineer The Haystack:Monitoring Network Behavior
What this talk is about • Admins: putting concepts in heads, tools in hands • Users: understanding how to monitor, how you can be monitored • Does Not Constitute Legal Advice • You are responsible obeying the law, regardless of what I say today! (et ignorantia juris non excusat) • All readily-available information, I offer no big secrets
Schiller's Haystack • 1993: The best protection is volume of information. Your best defense is obscurity, given the size of the “Haystack” • 2010: Anything that's not encrypted is no more private than what's on Facebook. • Your needle needs to be disguised, so it cannot be found. • And encryption is a can of worms (outside scope)
Packet Sniffing • Any computer that's part of a network can “see” some packets on its interface to that network • With certain software, you can examine and save the packets that are “visible” to your machine's interface • Many are intimidated by the task of packet sniffing; they spend time with less capable methods and get less useful results
the broadcast domain • On a switched network, each switch port will pass only traffic that is addressed to a destination connected to that port. • If your computer is connected directly to a switch port, then it will only get packets addressed to it, or to any group of destinations that includes it • On a multiple access segment (wireless, Ethernet hub) network, all packets are repeated to all destinations, and all computers can observe packets sent by other computers
the broadcast domain • Additionally, a wireless host can listen to wireless packets, regardless of association. (this takes special effort, probably need a Unix-like (e.g. BSD, Linux) computer
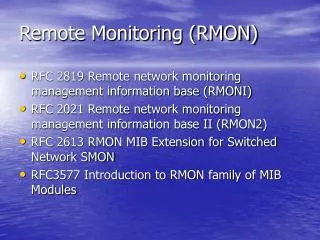
The Header Train • Ethernet (WiFi, Mobile) • ARP • IPv4 • TCP • SMTP * • IMAP/POP • HTML * • BitTorrent • etc • UDP • RTP * • DNS Queries • ICMP • Etc
Common (free) Sniffers • Wireshark (tshark, et al) nee Ethereal • Common GUI-based, all platforms • tcpdump • Eldest, CLI-based • ngrep • Allows capture based on packet contents • Etc.
Programming • libpcap • The basis for practically everything. Multi-OS compatible packet capture library, with interfaces written for most common languages • Scapy • Python module; allows VERY versatile packet level analysis and fabrication • Perl Module Net::Pcap • A simple Perl script can be faster than a complex C program (like tshark, tcpdump)
Dancing with yourself • It's easy (possibly even legal) to observe your own traffic, on a single-user computer • This can show you what traffic is reaching your interface, to examine, network “noise”, attack signatures, or simply to learn about sniffing • See web cookies, see if your password is “in the clear”, see why a connection is not working • See what traffic your computer is generating,
Dancing with yourself • Wireshark: menu: Capture->Interfaces Click “Options” next the interface with the highest packet count
Dancing with yourself • Wireshark: Capture options Capture Filter: “ip” uncheck (…) promiscuous
Self-sniffing pitfalls • Using a packet sniffer on a host that is participating in the traffic being sniffed may: • Fail CRC checks due to CRC off-loading • Have weird packet sizes due to TCP segmentation off-loading • It's usually cleaner to sniff from a non-participant host, using packet mirroring or an optical splitter • If you want to self-sniff and create capture files for reference, change interface properties to exclude any off-loading, to be safe
Mirroring or Splitting • In the 1990's, one machine on the campus FDDI or multi-access Ethernet backbone could see all (off-LAN) traffic • Now, in the switched world, all links are point to point, and there is no way for a third point to be on a link • Packet mirroring copies packets from a link to a sniffer port (this is called a SPAN session on Cisco IOS) • On fiber links, an optical splitter can divert light to a sniffer, requiring one observing interface per direction on the sniffer
Promiscuous capture • This places the “sniffing” interface in a special mode which enables it to receive packets bound for any destination, whether the local machine would normally receive them or not • On a switched network, promiscuous is not very different from non-promiscuous • Going non-promiscuous is a way to limit “noise” • On a major link between routers, it allows an observer to see everything
Legal issues • Significant distinction between “envelope” or “header” info and “content” • Persons who are employed as network/system admins may examine “header info” as part of their jobs • Law enforcement needs court orders to obtain network info, which may include compelling provider admins to collect and filter information
Privacy Issues • Always err on the side of caution • Never store traffic captures longer than their specific purpose calls for • Exposes them to subpoena • “ “ “ compromise • Never share raw captures with outsiders (except authorized law enf.) • Sanitize and obfuscate
Taking what you need • In doing surveys of OS types in use on our network in 2008, 2009 • Learned that a small, purpose-built Perl script is MUCH faster than a general case sniffer • Able to match only the piece of packet that had relevance to the survey and never examine or store the rest • Most sniffers offer “snap length” parameter, which allows capturing only the first so-many bytes of a packet • Saves storage, excludes “content” protects privacy
Storing/Sharing Captures • On a major link which carries about 40% of UH ingress/egress traffic, capturing 2 million packets takes about 10 seconds during a weekday afternoon. • If you limit capture to 60 bytes and estimate about half of that rate average, that's 518 GB per day (8.6 billion packets/day) • In order to analyze or characterize that data, you would need separate machines with access to the data, and keeping the analysis occuring at a 1 day per day rate would require constant optimization.
Storing/Sharing Captures • Sharing data outside the group of people who have a legal justification to access it is risky, and you must take steps to eradicate identifying information, including specific IP addresses
Sanitizing and Obfuscation • Even header information should be “sanitized” • IP addresses may show specific personal behavior and should be changed, but in a way that doesn't negate the analysis of traffic • Internet2 observatory deletes the rightmost 11 bits of all addresses in stored flow data • Several tools exist; if you write a program consider precedents carefully, there are pitfalls • In stored packet data, the “content” can be erased, which should not matter unless checksums are being studied
The “My ex is a net admin” - FAQ • Can my net admins read my email by sniffing? • Probably not, if you always choose the “secure” encrypted protocols, such as IMAPS, POPS, or web mail that uses SSL. ITS email set-up instructions will always specify secure protocols. • Can my ex tap my Internet phone conversations? • Skype – no. It is AES encrypted, unless you call China, Dubai, Pakistan, India (???) • Some others, perhaps. But ex would need access to the right links, and ex would be subject to criminal prosecution
The “I am a net admin” FAQ • How should I protect myself? • Tirelessly explain your monitoring activities to co-workers and supervisors and invite them to participate • Don't see anything you shouldn't • Capture as little as possible, take pains to protect (set permissions, encrypt) any stored capture data and get rid of it as soon as possible • Remember everything Yoda said about the nature of the Dark Side
Network Intrusion Detection Systems • A sniffer allows you to look at packets, a NIDS looks at them for you • Free ones: • Snort • Probably the broadest community support, medium difficulty to get going, they're trying to capitalize the signatures now, to support Snort • AIDE • Bro • Invented by Vern Paxson • (an Orwellian reminder that monitoring comes hand in hand with the potential for privacy violations)
Snorting (snort.org) Snort compares packets using “rules”, which are defined one-by-one to detect specific things, although some are heuristic To get to know Snort, you should disable all but one or two rules and see how that goes, and then add more rules to suit your needs
Bro (bro-ids.org ) How is Bro different from Snort? Snort is solely signature based, meaning that it looks for very specific content in the network stream and reports each instance of a particular signature. Bro can analyze network traffic at a much higher-level of abstraction, and has powerful facilities for storing information about past activity and incorporating it into analyses of new activity. Bro also provides a signature mechanism similar to Snort's. (excerpted from http://bro-ids.org/FAQ.html )
Intrusion Prevention System (IPS) Sniffs Examines traffic Takes action Interesting to note – although the Wikipedia article for NIDS lists examples, the IPS article does not.
Darknets and Honeypots A darknet (compare honeynet) is an empty network with a sniffer on it. The idea is that scanning attempts and “backscatter” from various activities will appear on the net as security references Contrast with honeypot, which is a decoy machine set up to detect intrusion attempts, etc.
ICMP Backscatter tcpdump -ln -i eth1 -w noping-icmp.cap 'icmp[icmptype] != icmp-echo and icmp[icmptype] != icmp-echoreply' Captured with tcpdump, displayed in Wireshark.
Traffic Characterization/Identification • Task of seeing what kind of traffic is on net • Harder than it looks • TCP/UDP port numbers are often meaningless • Many apps are port-agile • BitTorrent uses HTTP-style protocol, sometimes on port 80 • Effective traffic identification involves seeing every header and understanding protocols • Also interesting to sort by geographic location (per MaxMind GeoIP )
Byte-Value Distribution Histograms Stdev % of a-mean 253% 12% 1.3%
Byte-Value Distribution Histograms Stdev % of a-mean 0.05% 57% Text emphasizes a small set of characters, Binary streams (audio/video) involve more widely spread values Encryption aspires to appear random, and therefore has a flat distribution Stuff with a text-like distribution is probably text, even if obscured Stuff with an exceptionally flat distribution is probably encrypted UDP-based stuff with double digit % std dev may be audio/video
SNMP • Although more secure(-ish) flavors have been developed, the vast majority of SNMP is SNMP versions 1 or 2c. • Access control is generally through a “community” name which is generally well known and visible on the wire in SNMP packets • Using community “public” is negligent insanity • If your network printer is using the factory config, it's a sitting duck
Netflow • Routers and switches send information about network “flows” to a flow collector. • Flows include source and destination addresses, port (TCP or UDP) numbers, router interface, and volume of traffic • Flows usually reflect less than 100% of traffic through a router. • Free tools for dealing with netflow data are available (e.g. flow-tools); not as cool as sniffer tools
Simple Network Management Protocol(SNMP) • Routers, switches provide extensive information about what they're doing • Interface packet/byte counts, up-time, temperatures, route tables, forwarding caches, etc. • Servers, printers, wireless APs, SOHO gateways • SNMP provides variables for a mgmt station to query, or traps, which are messages initiated by the router, switch, printer, etc, in question.
Topology Discovery In a network where you know the SNMP community names, it is reasonably simple to use bridge and route tables to discover network topology. This provides a list of network devices (routers, switches), and interfaces.
Non-Passive Monitoring • NMAP • Scans for listening TCP/UDP services on a host • Other scanners apply tests for vulnerabilities • SAINT • MetaSploit • Nessus (source moved from open to closed) • OpenVAS (fork of Nessus's open source)
Network quality checking: web100 • The Web100 add-ons for Linux allow an observer to collect stats on TCP connections, to determine whether the network is performing well • Info available includes indicators of congestion, TCP host tuning, and throughput • Examples apps that use web100: NDT, NPAD
Host accounting • It is necessary to account for the computers on a network for many reasons • Host infections • Unacceptable behaviors • Identifying stolen devices • This can be done by gathering ARP/ND tables using SNMP, or by parsing switch logs or DHCP server logs.
Host OS Survey (Perl fragment) if ($pkt =~ /(User-Agent: .*)/i) { $matchcounter++; my $ua = $1; $ua =~ s/^user-agent: //i; print "$ipsrcadd^$ua\n"; } • “User-Agent: is placed in an HTTP request header by a browser, and most identify the operating system in use, but not a specific host. This example never captures anything but UA.
Service accounting • ngrep -d eth1 -O ngrep-server-hdrs2.cap -q "HTTP/.*Server: .*Content-Type: text/" \(src net 128.171 or src net 132.160 or src net 166.122 or src net 168.105\) • Find HTTP servers on our nets, regardless of port • tcpdump -i eth0 -ln 'tcp[13] & 18 = 18' and src port 25 • Find services answering TCP port 25 (commonly SMTP)