Monday, February 10 th
170 likes | 344 Vues
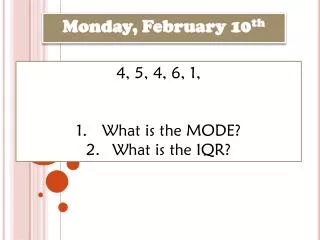
4, 5, 4, 6, 1, What is the MODE? What is the IQR?. Monday, February 10 th. EOCT Week 4-# 1. Which statement is false for the function y = 2x + 1? It has no maximum or minimum It is always decreasing. It is positive and negative . It has a constant rate of change.

Monday, February 10 th
E N D
Presentation Transcript
4, 5, 4, 6, 1, What is the MODE? What is the IQR? Monday, February 10th
EOCT Week 4-#1 Which statement is false for the function y = 2x + 1? It has no maximum or minimum It is always decreasing. It is positive and negative. It has a constant rate of change.
A Look Ahead Monday: Box and Whiskers Day 1 Tuesday: Box and Whiskers Day 2 Wednesday: Dot Plots and Histograms Thursday: Review Friday: Test #2-Statistics Part 1
Friendly Reminders • All Missing work may be turned in late for half credit (50%) for this unit BY THIS FRIDAY! • When you are absent, it is your responsibility to check website or with us about what you missed • If you are gone on the day before a quiz or test you are still responsible to take the quiz or test • If you want to retake Test #1-Characteristics, it needs to be done BY THIS FRIDAY!!!! • Check tutoring schedule
Quiz Answers 4 pts each
Box & Whiskers
Box Plot (Box & Whisker) A plot showing the minimum, maximum, first quartile, median, and third quartile of a data set; the middle 50% of the data is indicated by a box. Example:
Important Every section represents 25% of the data Min to Q1=25% Q1-Median=25% Median-Q3=25% Q3-Max=25%
Step 1: Find Median The middle-most value of a data set; 50% of the data is less than this value, and 50% is greater than it Example:
Step 2: Find First Quartile The value that identifies the lower 25% of the data; the median of the lower half of the data set; written as Example:
Step 3: Find Third Quartile Value that identifies the upper 25% of the data; the median of the upper half of the data set; 75% of all data is less than this value; written as Example:
Step 4: Max and Min This WHISKERS!!! 2, 3, 5, 7, 8, 10, 14, 18, 19, 21, 25, 28 6 12 20
Making a box and Whisker • Create a box plot for the following data. Label the important measures Total Points in Atlanta Hawks Games 67, 52, 54, 57, 61, 56, 61, 69, 63, 57, 60, 50
Example 1 • What percent of the golf scores are over 88? • What percent of golf scores are under 93? • What is the range of the middle 50% of the data? • What is the range of the data? • What was the highest golf score? • Describe the shape. 78 81 84 87 90 93 96 99 102 105 108 111 114 117 120 123 126 Golf Scores
Example 2 • Who has a higher median? • Who has a lower range? • Who studies more on average? • Which graph is more skewed to the right? Comparing Men and Women Study Habits and Attitudes Women 60 70 80 90 100 110 120 130 140 150 160 170 180 190 200 210 220 Men
Classwork/Homework • Complete “ticket to Go”- 2 pts Extra Credit towards Quiz for each question correct • Complete Homework