TIME SERIES MULTISENSOR SATELLITE DATA
EARSeL 4th Workshop on Remote Sensing and Geology, Mykonos, 24-25 May 2012 Time Series Satellite Data for Seismic Precursors Assessment. Maria Zoran - National Institute of R&D for Optoelectronics ,Remote Sensing Department, Bucharest-Magurele, Romania mzoran@inoe.inoe.ro ;.


TIME SERIES MULTISENSOR SATELLITE DATA
E N D
Presentation Transcript
EARSeL4th Workshop on Remote Sensing and Geology, Mykonos, 24-25 May 2012Time Series Satellite Data for Seismic Precursors Assessment Maria Zoran- National Institute of R&D for Optoelectronics ,Remote Sensing Department, Bucharest-Magurele, Romania mzoran@inoe.inoe.ro;
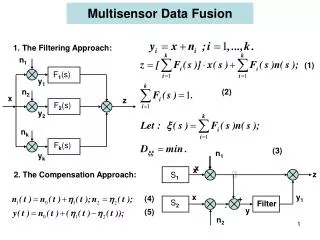
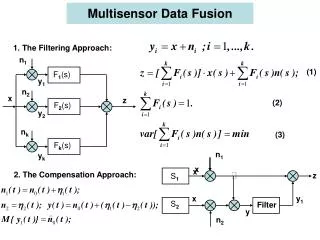
TIME SERIES MULTISENSOR SATELLITE DATA • Remote sensing satellites provide data useful in seismic precursors assessment and disaster management : • -mapping and monitoring of seismic hazards, • -assessment of damage extent of strong earthquakes. • A seismotectonic zone , capable of generating earthquakes can be investigated by remote sensing data: • -to emphasize geomorphorogical features • -to identify faulting zones responsible of seismic events generation. • Remote sensing analysis and field studies of active faults provide a geologic history better than instrumental and historic records. • GPS NETWORK DATA • Integrated GPS Network are providing precise time-dependent information on how the earth’s crust responds to earthquakes and plate tectonic processes. • SYNERGY use of satellite, GPS, and in-situ field data
Nonprecursory information predicts the earthquakes expected from the previously recorded rates of earthquakes- Long-term earthquake prediction (probabilistic or deterministic) has extensively used earthquake rates for nonprecursory iformation from geologic and geodetic information. Short-term earthquake prediction is based on analysis of foreshocks and nonseismic potential precursors-considers ground water changes, strain rates and geoelectrical and geomagnetical phenomena related to earthquakes are causal precursors. Predictive precursors assume a causal relationship with the mainshock and provide information about the earthquake hazard better than achievable by assuming a random distribution of earthquakes. Earthquake prediction has two potentially compatible but distinctly different objectives: (a) phenomena that provide information about the future earthquake hazard useful to those who live in earthquake-prone regions and (b) phenomena causally related to the physical processes governing failure on a fault that will improve our understanding of those processes.
Earthquake precursors differentiated by the characteristic lead-time between precursor and the strong earthquake: long-term (LT)-tens of years; intermediate-term (IT)- years; short-term (ST)- months; immediate (Im)- days and less. Possible mechanism for the generation of electromagnetic waves in the lithosphere was identified through the microfracturing process of rocks responsible forgeoelectric and geomagnetic fields anomalies as well as development of strong ionospheric perturbations preceding strong earthquakes. This paper aims at investigating : the TEC ionospheric and solar geomagnetic precursors during one of the greatest major earthquake in Tohoku area, Japan, 11th March 2011, based on time series solar, geomagnetic and ionospheric Total Electron Content data provided by NOAA, WDC Australian, Space Environment Information Service Japan, British Geological Survey and World Data Center for Geomagnetism, Kyoto.
TEST AREA and Tohoku-Oki earthquake DATA 11 March 2011 14:46 JST(05:46 UTC) ; Moment magnitude Mw 9.0 occurred on the Japan Trench plate boundary off the Eastern shore of Northern Honshu, followed by : the largest tsunami on Japan Pacific coast, affecting a 400–500 Km area Fukushima NPP colapse and radioactive cloud over Pacific, Europe… Epicenter was located at 38.1 °N, 142.9 °E, off the Pacific coast of the North-Eastern part of the Japanese main land (Tohoku Region), at depth of 24 km and about 130 km East of Sendai town and 373 km North-East of Tokyo. The main shock was preceded by a foreshock sequence lasting two days. The largest of these was an Mw 7.3 earthquake on 9 March 2011
AFTERSHOCKS (as of 30 April 2012)M 7.6 at 11 March 2011 15:15 JST (06:15 UTC);Number:6(M 7 or greater);102(magnitude 6 or greater);671(M 5 or greater)
DATA USED World Data Centre (WDC) for Solar-Terrestrial Science (STS) Australia (http://www.ips.gov.au/World_Data_Centre), for GPS Vertical TEC Global Maps ; National Oceanic and Atmospheric Administration NOAA validated on ionosonde data ( http://helios.swpc.noaa.gov/ctipe/TEC.html), and Ionospheric and Atmospheric Remote Sensing web site http://iono.jpl.nasa.gov . Geomagnetic and solar data have been also provided by Space Environment Information Service Japan (http://hirweb.nict.go.jp/) as well as by International Real-time Magnetic Observatory Network ( INTERMAGNET) at (http://www.intermagnet.org); British Geological Surveyhttp://www.geomag.bgs.ac.uk/ , and World Data Center for Geomagnetism, Kyotohttp://wdc.kugi.kyoto-u.ac.jp. MODIS Terra/Aqua Land Surface Temperature/Emissivity ( LST/E ) [http://daac.ornl.gov/MODIS/modis.html ; Japan Meteorological Agency (http://www.jma.go.jp). http://www.kakioka-jma.go.jp/
Space-based geodetic measurements of the solid Earth with the Global Positioning System in synergy with ground-based seismological measurements, interferometric synthetic aperture radar data, high-resolution digital elevation models as well imaging spectroscopy (e.g. using ASTER, MODIS and Hyperion data) are contributing significantly to seismic hazard risk assessment. Space-time anomalies of Earth’s emitted radiation (radon in underground water and soil , thermal infrared in spectral range measured from satellite months to weeks before the occurrence of earthquakes etc.), ionospheric and electromagnetic anomalies have been interpreted, by several authors, as pre-seismic signals .
Ionosphere (90km-1000 km) is subjected to a number of different forces from both, below and above the ionosphere, the major impact being due to solar forcing Atmospheric perturbations induced by earthquakes, volcano eruptions, weather fronts and nuclear explosions can induce signatures in the ionospheric plasma density by atmospheric–ionospheric-lithospheric coupling processes.
The Dst index represents the axially symmetric disturbance magnetic field at the dipole equator on the Earth's surface. Some disturbances in Dst can be related with earthquake
Time series Atmospheric Electric Field –Kakioka station 2-15 March 2011
GPS TEC variation during 23 February- 15 March 2011TEC enhancement in the ionospheric electron content several days before earthquake , strong increase one day prior Eq.Possible em emissioms ULF to VLF frequency from the epicenter to a very large radius area, propagation to the ionosphere possibly generates the TEC anomalies.
Test areas : Eq epicenter (a); Sendai region (b); Fukushima (c); Tokyo (d)a) b) c) d)
LST variation during 1 January- 30 March 2011 near 11 March Tohoku earthquake epicenter
JAPAN Year 2011 January February March Northern Japan Eastern Japan Western Japan Okinawa and Amami Time-series of 5-days running mean air temperature anomaly Air Temperature Anomaly over Japan
Time series 10-day mean air temperature and anomaly over 21 February -21 March 2011, on the base period of normals 1981-2010 around Japan.
CONCLUSION • From 7 March - 10 March, the geomagnetic field was at quiet to unsettled levels with isolated high latitude active periods. • During the entire analyzed period 7 March – 14 March 2011, solar activity ranged from low to high levels decreasing again to low levels. • Quantitative analysis of TEC data before and during the occurrence of earthquake shows the consistent enhancement in the ionospheric electron content several days before earthquake, with a strong increase one day prior Tohoku earthquake. • The emission of electromagnetic radiations from ULF to VLF frequency range from the epicenter to a very large radius area and their subsequent propagation to the ionosphere possibly generates the TEC anomalies. • The analysis of all available geospatial data shows evidence of a thermal build up near the epicentral area of 11 March Tohoku earthquake.