Download
1 / 52
520 likes | 591 Vues
Explore findings from a phone survey on the Los Angeles River community's knowledge, development needs, concerns, and demographics, providing valuable insights for policymakers and stakeholders. Gain an understanding of residents' preferences for green development, community needs, and perceptions of river conditions. The study delves into differing perspectives based on demographics and proximity to the river, shedding light on key issues facing the community.

E N D
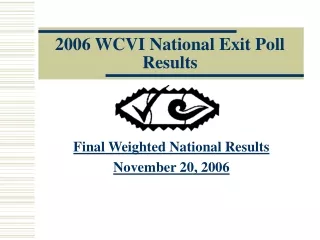
Summary of 2006 WCVI Los Angeles River Phone Survey February 8th, 2007
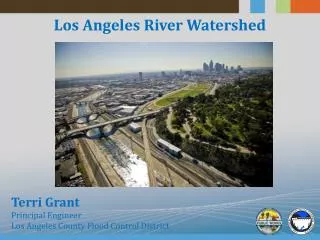
WCVI Los Angeles River Phone Survey • Recently, the William C. Velásquez Institute conducted a random phone survey of 401 respondents of the Los Angeles River community. The Greening of the Los Angeles River project part of the Institute’s Community Development program started as part of a diverse alliance of local and city nonprofits including the Anahuak Youth Soccer Association, the City Project, Mujeres de la Tierra, and Remapping-L.A. • This study seeks to examine the knowledge of the Los Angeles River community and its constituents on the Los Angeles River Revitalization project, development needs for the Los Angeles River community and concerns and needs of the Los Angeles River neighborhoods. • In addition, this study seeks to shed some light to policymakers on the subtle differences between various demographics groups within the Los Angeles River community and show some interesting findings with these groups. Often neighborhoods can be clustered as having many of the same issues and concerns and while in many cases this can be true, further analysis shows that even within a five mile radius a community can be diverse with matters.
Methodology • Survey Methodology: • The 2006 Los Angeles River Study reached 401 adults over the age of 18 who live in cities bordering the Los Angeles River. The survey was fielded from September 6th-8th, 2006. • The survey was called using targeted Random Digit Dial sample.Respondents were further screened by zip code. Only respondents who lived within the following zip codes were surveyed: 91316, 91401, 91403, 91406, 91411, 91423, 91436, 91601, 91602, 91604, 91607, 90012, 90013, 90014, 90017, 90021, 90023, 90026, 90027, 90031, 90033, 90039, 90058, 90065, 90068, and 90071. • The survey was administered in both English and Spanish by a trained bilingual staff. • The margin of error at the 95% confidence level is +/-4.9%.
Highlighted Groups: • Some groups highlighted will include: • Individuals who live within 2 miles of the river and those who live over 2 miles • White Non-Hispanic versus Hispanic • Naturalized Citizen versus Non-Citizen • Western Zip Codes versus Eastern Zip Codes • Latinos who live within 2 miles of the Los Angeles River • According to the LA River study, 44% of those interviewed identified living within 2 miles or less of the Los Angeles River. 46% lived more than 2 miles. All phone respondents selected lived at least within 5 miles of the Los Angeles River. 56% lived in the Eastern zip codes while 44% resided in the Western portion.
How close do you live to the Los Angeles River? Source: WCVI LA River Phone Study conducted September 11,2006, margin of error +/- 4.89%
Have you heard of the plan to revitalize the Los Angeles River? • Only 27% heard of the plan to revitalize the Los Angeles River versus 71% who identified no knowledge of the project. Of the 27% who identified knowledge of the project, newspapers were the number one medium by which they learned of the project at 59%. Television, 44% and meetings, 16% came second and third respectively. Source: WCVI LA River Phone Study conducted September 11,2006, margin of error +/- 4.89%
If yes, how? Source: WCVI LA River Phone Study conducted September 11,2006, margin of error +/- 4.89%
Type of Development • The community was most interested in seeing green development in the Los Angeles river community. The top 3 responses were green choices: Parks, 43%, Open Green Spaces, 35% and California style trees and plants instead of cement recreation facilities, 28%. Affordable housing/apartments, 22% and schools, 22% were the next choices in development for the community. It would stand to reason that community members don’t separate the concepts of quality green space and quality education or housing. To that end, the next two suggestions are also green concepts: community gardens, 17% and Soccer and baseball fields, 16%. • The last development idea to get over at least 10% was Job creating business. In this community, the constituents understand no progress will come unless the community has economic opportunity and economic opportunity will come from new businesses.
What type of development would you like to see on the river and its banks? Source: WCVI LA River Phone Study conducted September 11,2006, margin of error +/- 4.89%
Conditions Around the River • Another area of concern for the community was conditions around the Los Angeles River. Air/water/land quality incited the most negative responses with 66% responding that conditions were “only fair or poor.” Physical landscape was also a top concern with 64% respondents identifying the area as “only fair or poor.” Public safety, which will show up again, was also identified negatively by 61%. Finally, recreation facilities were also seen in a negative light by 58% of the constituents.
How would you rate the following conditions in and around the Los Angeles River-excellent, good, fair, or poor? Source: WCVI LA River Phone Study conducted September 11,2006, margin of error +/- 4.89%
Most Important Problems in your Neighborhood • Following the theme of the previous question, “Gangs, crime, safety” was identified as the most important problem in your neighborhood at 34%. The prevailing theme of a lack of security seems to be tied to a concern with green spaces as seen in earlier questions. To that end, 13% identified “Trash/clutter” as the second biggest problem in their neighborhood. • Two of the next three issues are concurrently related to gangs and safety. 7% identified “lack of activities for youth” and 6% “inadequate schools.” Both theses issues directly affect the youth in Los Angeles river community and their involvement in the community. Lack of activities can lead to lack of involvement and with children coming from homes where parents work two to three jobs, children need after school activities. Schools, once seen as a stepping stone to success in communities like those around the Los Angeles River have become overcrowded and outdated.
Problems in your neighborhood Source: WCVI LA River Phone Study conducted September 11,2006, margin of error +/- 4.89% In addition, community members, identify the need to build better infrastructure in the form of roads and bridges, 6%. Tied with earlier themes, economic development can’t take place unless better infrastructure is built in the community to attract commerce.
Demographics • The Los Angeles River community is an extremely sedentary community with 67% identifying living in the neighborhood for at least 5+ years and 26% living there for more than 20 years. Only 32% have lived in the community under 5 years and 13% under 2 years. Source: WCVI LA River Phone Study conducted September 11,2006, margin of error +/- 4.89%
Country of Birth • 51% of the Los Angeles River sample identified as native born. 49% identified as foreign born with Mexico receiving the most respondents of any country, 22%. Other country, which a respondent had to specify received 15%, El Salvador, 7%, Guatemala, 4%, China, 1%, and South Korea, 1%. Source: WCVI LA River Phone Study conducted September 11,2006, margin of error +/- 4.89%
Citizenship & Voter Registration • 68% of the sample were naturalized citizen, while 32% identified not being citizen. Of those who identified being a citizen, 77% were registered to vote. Source: WCVI LA River Phone Study conducted September 11,2006, margin of error +/- 4.89%
Race/Ethnic Groups • Hispanic/Latino made up the largest racial/ethnic percentage at 48%. White Non-Hispanics were 34% while Asian and Pacific Islander were 9%. Other was 4%. African-American was 2%. Source: WCVI LA River Phone Study conducted September 11,2006, margin of error +/- 4.89%
Age Groups • The sample was fairly evenly distributed amongst age groups. 35% of the sample was 34 or younger. 37% of the sample was between the ages 35-54. Only 24% of the sample was 55 or older. Source: WCVI LA River Phone Study conducted September 11,2006, margin of error +/- 4.89%
Educational Attainment • There were a disproportionate number of individuals who reported a high school education or less, 45%, although these figures fall within Census reported statistics. 17% reported some college or vocational training. 32% reported being a college graduate or higher. Crosstabs will show that these various greatly by the zip code region one lives in within the Los Angeles river community. Source: WCVI LA River Phone Study conducted September 11,2006, margin of error +/- 4.89%
Income • 23% make less than $15,000. 26% make between $15,000 and $39,999. 17% make between $40,000 and $99,999. 7% make $100,000 to $149,999. Again, crosstabs will bear out that these various greatly by the zip code region one lives in within the Los Angeles river community. Source: WCVI LA River Phone Study conducted September 11,2006, margin of error +/- 4.89%
Household Languages • Finally, 90% of the Los Angeles river communities speak either English or Spanish with English being the dominant language at 54%. Other languages were identified at 7%. Chinese and indigenous languages were identified at 1% respectively. Source: WCVI LA River Phone Study conducted September 11,2006, margin of error +/- 4.89%
PROXIMITY CROSSTABS • Proximity Crosstab: Highlights • How close do you live to the Los Angeles River? • The following cross tabulation will examine the Los Angeles River community by the variable of proximity to the river: Less than or equal to 2 miles versus Greater than 2 miles. • We will highlight the key findings: • Individuals who live within 2 miles of the Los Angeles River are significantly more knowledgeable of the revitalization plans for the river.
PROXIMITY CROSSTAB: Have you heard of the plan to revitalize the Los Angeles River? Source: WCVI LA River Phone Study conducted September 11,2006, margin of error +/- 4.89%
PROXIMITY CROSSTAB: What type of development would you like to see on the river and its banks? • As before, 3 of the top five issues for the crosstab were green issues with parks leading for both variables at 40% and 45%, respectively. Source: WCVI LA River Phone Study conducted September 11,2006, margin of error +/- 4.89%
PROXIMITY DIFFERENCES • The largest aggregate differences the quality of the conditions of the area could be seen in the air/water/land quality and the public safety. The baseline for air/water/land quality showed a net negative of 66% while individuals who live under 2 miles identified 58% negative responses and individuals over 2 miles showed a net negative of 60%. Similarly, in public safety, 61% identified in the baseline negative responses, showed a net negative of 61% while individuals who live under 2 miles identified 56% negative responses and individuals over 2 miles showed a net negative of 66%.
PROXIMITY CROSSTAB: How would you rate the following conditions in and around the Los Angeles River- excellent, good, fair, and poor? (Air, water, land quality around LA river) Source: WCVI LA River Phone Study conducted September 11,2006, margin of error +/- 4.89%
PROXIMITY CROSSTAB: How would you rate the following conditions in and around the Los Angeles River- excellent, good, fair, and poor? (Public safety around LA river) Source: WCVI LA River Phone Study conducted September 11,2006, margin of error +/- 4.89%
PROXIMITY CROSSTAB:Top Issues in Neighborhood • The top issues for this crosstab are not dissimilar to the baseline with Gangs/Crime/Safety topping the list in both variables. Trash and clutter also comes in second. Source: WCVI LA River Phone Study conducted September 11,2006, margin of error +/- 4.89%
ETHNIC DIFFERENCES • The individuals who live closer to the river tend to be a more vested in the community than those who live father away, 66% to 71%. • When we disaggregate other races and look at only White Non-Hispanic and Latinos, the two communities look very different ethnically. Closer to the river, they are evenly split 53% to 47% between White and Latino but further away beyond 2 miles, the variation is about 35% to 65% towards Latinos.
Lived in your neighborhood? Source: WCVI LA River Phone Study conducted September 11,2006, margin of error +/- 4.89%
White vs. Latino Comparison Source: WCVI LA River Phone Study conducted September 11,2006, margin of error +/- 4.89%
ETHNIC CROSSTABS • The following cross tabulation will examine the Los Angeles River community by the variable of Race/Ethnicity. • We will highlight the key findings: • Whites tend to live closer to the river within 2 miles, 55% to 44%.
ETHNIC CROSSTAB: Proximity to the River Source: WCVI LA River Phone Study conducted September 11,2006, margin of error +/- 4.89%
ETHNIC CROSSTAB:Knowledge of Los Angeles River • Whites are significantly more knowledgeable of the revitalization plans for the river than Latinos. Source: WCVI LA River Phone Study conducted September 11,2006, margin of error +/- 4.89%
As before, 3 of the top five issues for this crosstab were green issues with parks leading for both variables at 35% and 48%, respectively. Unlike last time, Latinos see Parks as a significant issue in the community at nearly 50%. Source: WCVI LA River Phone Study conducted September 11,2006, margin of error +/- 4.89% *Responses more than100% due to multiple responses
ETHNIC CROSSTAB: Recreation Facilities • The largest aggregate differences can been seen in the views of the conditions of the recreation facilities. Latinos didn’t see them as poorly as Whites, 30% to 37%. Source: WCVI LA River Phone Study conducted September 11,2006, margin of error +/- 4.89%
ETHNIC CROSSTAB: Top Issues in your Neighborhood • The top issues for this crosstab are not dissimilar to the baseline with Gangs/Crime/Safety topping the list both variables. Trash and clutter also comes in second. Source: WCVI LA River Phone Study conducted September 11,2006, margin of error +/- 4.89%
CITIZENSHIP CROSSTABS • Citizenship Crosstab: Highlights • Citizens versus Non-Citizens • The following cross tabulation will examine the Los Angeles River community by the variable of Citizenship. • We will highlight the key findings: • Citizens tend to live closer to the river within 2 miles, 47% to 36%. 42% of Non-Citizens live 3 miles or farther.
CITZENSHIP CROSSTAB:Proximity to the LA River Source: WCVI LA River Phone Study conducted September 11,2006, margin of error +/- 4.89%
CITZENSHIP CROSSTAB: Knowledge of the Los Angeles River • Individuals who live within 2 miles of the Los Angeles River are significantly more knowledgeable of the revitalization plans for the river. Source: WCVI LA River Phone Study conducted September 11,2006, margin of error +/- 4.89%
As before, 3 of the top five issues for this crosstab were green issues with parks leading for both variables at 39% and 52%, respectively. Unlike last time, Non-Citizens see Parks as a significant issue in the community at over 50%. Source: WCVI LA River Phone Study conducted September 11,2006, margin of error +/- 4.89% *Responses more than100% due to multiple responses
ZIP CODE CROSSTABS • The following cross tabulation will examine the Los Angeles River community by the variable of Zip codes: Individuals who live in the Eastern Zip Codes versus Western Zip Codes. • We will highlight the key findings: • The largest aggregate differences in the quality of the area could be seen in public safety. Individuals in the Eastern zip codes rated public safety at the farthest spectrum, “poor”, 35% , nine points lower than those in the Western zip codes.
ZIP CODE CROSSTAB:Public Safety Source: WCVI LA River Phone Study conducted September 11,2006, margin of error +/- 4.89%
ZIP CODE CROSSTAB: TOP ISSUES • As before, two out of the top five issues in the neighborhood are not dissimilar to the baseline with Gangs/Crime/Safety topping the list for both variables. Trash and clutter also comes in second. There is a lack of consensus on the next issues. In the East, after Trash, improving roads & lack of activities for youth were important. In the West, all the issues seemed important as well as the lack of youth activities and non listed issues.
ZIP CODE CROSSTAB: Top Issues Source: WCVI LA River Phone Study conducted September 11,2006, margin of error +/- 4.89
ZIP CODE CROSSTAB: Languages Spoken • The study shows an even split in language usage of between English and Spanish in the Eastern region. Overall, Spanish is 16 points more prevalent in the Eastern region. Source: WCVI LA River Phone Study conducted September 11,2006, margin of error +/- 4.89
“LATINO 2 MILE” CROSSTABS: Latinos who live within 2 miles Crosstabs • Latinos who Live within 2 Miles Crosstabs: Highlights • The following cross tabulation will examine the Los Angeles River community by the variable of Latinos who live within two miles of the Los Angeles river. • We will highlight the key findings: • Latinos who live within 2 miles are significantly less knowledgeable of the revitalization plans for the river, 20% to 27%.
LATINO 2MILE CROSSTAB: Heard of plans to revitalize LA River Source: WCVI LA River Phone Study conducted September 11,2006, margin of error +/- 4.89%
LATINO 2MILE CROSSTAB: Zip codes • 77% of individuals who lived within 2 miles fell within the Eastern zip codes, a marked difference from the baseline. Source: WCVI LA River Phone Study conducted September 11,2006, margin of error +/- 4.89%
LATINO 2MILE CROSSTAB: Nativity • 63% of individuals who lived within 2 miles were Foreign Born, a marked difference from the baseline. Source: WCVI LA River Phone Study conducted September 11,2006, margin of error +/- 4.89%