Download
1 / 49
980 likes | 2.27k Vues
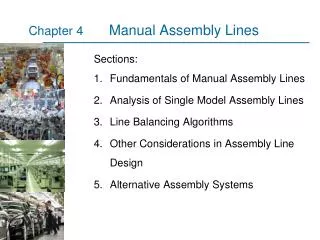
Manual Assembly Lines. Chapter 4. Sections: Fundamentals of Manual Assembly Lines Analysis of Single Model Assembly Lines Line Balancing Algorithms Other Considerations in Assembly Line Design Alternative Assembly Systems. Manual Assembly Lines.

E N D
Manual Assembly Lines Chapter 4 Sections: • Fundamentals of Manual Assembly Lines • Analysis of Single Model Assembly Lines • Line Balancing Algorithms • Other Considerations in Assembly Line Design • Alternative Assembly Systems
Manual Assembly Lines • Work systems consisting of multiple workers organized to produce a single product or a limited range of products • Assembly workers perform tasks at workstations located along the line-of-flow of the product • Usually a powered conveyor is used • Some of the workstations may be equipped with portable powered tools. • Factors favoring the use of assembly lines: • High or medium demand for product • Products are similar or identical • Total work content can be divided into work elements • To automate assembly tasks isimpossible
Why Assembly Lines are Productive • Specialization of labor • When a large job is divided into small tasks and each task is assigned to one worker, the worker becomes highly proficient at performing the single task (Learning curve) • Interchangeable parts • Each component is manufactured to sufficiently close tolerances that any part of a certain type can be selected at random for assembly with its mating component. • Thanks to interchangeable parts, assemblies do not need fitting of mating components
Some Definitions • Work flow • Each work unit should move steadily along the line • Line pacing • Workers must complete their tasks within a certain cycle time, which will be the pace of the whole line Examples Automobile, camera, furniture, lamp, luggage, personal computer, mobile phone, video game console …
Manual Assembly Line • A production line that consists of a sequence of workstations where assembly tasks are performed by human workers • Products are assembled as they move along the line • At each station a portion of the total work content is performed on each unit • Base parts are launched onto the beginning of the line at regular intervals (cycle time) • Workers add components to progressively build the product
Manual Assembly Line • Configuration of an n-workstation manual assembly line • The production rate of an assembly line is determined by its slowest station. • Assembly workstation:A designated location along the work flow path at which one or more work elements are performed by one or more workers
Two assembly operators working on an engine assembly line Final inspection of a car
Manning level • There may be more than one worker per station. • Utility workers: are not assigned to specific workstations. • They are responsible for • helping workers who fall behind, • relieving for workers for personal breaks, • maintenance and repair
Manning level Practically, average manning level: where M=average manning level of the line, wu=number of utility workers assigned to the system, n=number of workstations, wi=number of workers assigned specifically to station i for i=1,…,n Average manning level:
Work Transport System Manual method Mechanized Methods
Work Transport Systems-Manual Methods • Manual methods • Work units are moved between stations by the workers (by hand) without powered conveyor • Problems: • Starving of stations • The assembly operator has completed the assigned task on the current work unit, but the next unit has not yet arrived at the station • Blocking of stations • The operator has completed the assigned task on the current work unit but cannot pass the unit to the downstream station because that worker is not yet ready to receive it.
Work Transport Systems-Manual Methods • To reduce starving, • use buffers • To prevent blocking, • provide space between upstream and downstream stations. • But both solutions can result in higher WIP, • which is economically undesirable.
Work Transport Systems-Mechanized Methods • Continuously moving conveyor: operates at constant velocity • Work units are fixed to the conveyor • The product is large and heavy • Worker moves along with the product • Work units are removable from the conveyor • Work units are small and light • Workers are more flexible compared to synchronous lines, less flexible than asynchronous lines • Synchronous transport (intermittent transport – stop-and-go line): all work units are moved simultaneously between stations. • Problem: • Task must be completed within a certain time limit. Otherwise the line produces incomplete units; • Excessive stress on the assembly worker. • Not common for manual lines (variability), but often ideal for automated production lines • Asynchronous transport:a work unit leaves a given station when the assigned task is completed. • Work units move independently, rather than synchronously (most flexible one). • Variations in worker task times • Small queues in front of each station.
Coping with Product Variety • Single model assembly line (SMAL) • Every work unit is the same • Batch model assembly line (BMAL ) – multiple model line • Two or more different products • Products are so different that they must be made in batches with setup between batches • Mixed model assembly line (MMAL) • Two or more different models • Differences are slight so models can be made simultaneously with no setup time (no need for batch production)
Coping with Product Variety • Advantages of mixed models over batch order models • No production time is lost during changeovers • High inventories due to batch ordering are avoided • Production rates of different models can be adjusted as product demand changes. • Disadvantages of mixed models over batch order models • Each station is equipped to perform variety of tasks (costly) • Scheduling and logistic activities are more difficult in this type of lines.
Analysis of Single Model Lines • The formulas and the algorithms in this section are developed for single model lines, but they can be extended to batch and mixed models. • The assembly line must be designed to achieve a production rate sufficient to satisfy the demand. • Demand rate → production rate→ cycle time • Annual demand Da must be reduced to an hourly production rate Rp where Da = annual demand Rp = hourly production rate Sw = number of shifts/week Hsh = number of hours/shift Ow = number of operation weeks
Analysis of Single Model Lines • Now our aim is to convert production rate,Rp, to cycle time,Tc. • One should take into account that some production time will be lost due to • equipment failures • power outages, • material unavailability, • quality problems, • labor problems. • Line efficiency (uptime proportion):only a certain proportion of the shift time will be available. where production rate,Rp, is converted to a cycle time,Tc, accounting for line efficiency,E. Rc = Ideal cycle rate for the line (cycle/hr) Cycle time Ideal cycle time
Analysis of Single Model Lines Rc< Rp[Ideal cycle rate must be less than required production rate] Line efficiency, Tp = average production cycle time =Tp = 60/ Rp WL = workload in a given time period AT = available time in the period No of worker, Workload to be accomplished Rp= production rate Twc = work content time *60 minute Available time Work content time (Twc): The total time of all work elements that must be performed to produce one unit of the work unit.
Analysis of Single Model Lines • The theoretical minimum number of stations that will be required to on the line to produce one unit of the work unit, w*: w* = Minimum Integer where Twc = work content time, min; Tc = cycle time, min/station If we assume one worker per station then this gives the minimum number of workers
Theoretical Minimum Not Possible.. • Repositioning losses: Some time will be lost at each station every cycle for repositioning the worker or the work unit; thus, the workers will not have the entire Tc each cycle • Line balancing problem (imperfect balancing): It is not possible to divide the work content time evenly among workers, and some workers will have an amount of work that is less than Tc
Repositioning Losses • Repositioning losses occur on a production line because some time is required each cycle to reposition the worker, the work unit, or both • On a continous transport line, time is required for the worker to walk from the unit just completed to the the upstream unit entering the station • In conveyor systems, time is required to remove work units from the conveyor and position it at the station for worker to perform his task.
Repositioning Losses • Repositioning time = time available each cycle for the worker to position = Tr • Service time = time available each cycle for the worker to work on the product = Ts • Service time, Ts = Max{Tsi} ≤Tc – Tr where Tsi= service time for station i, i=1,2,..,n • Repositioning efficiency Er =
Cycle Time on an Assembly Line • Components of cycle time at several stations on a manual assembly line • Tsi=service time, Tr=repositioning time
Line Balancing Problem Given: • The total work content consists of many distinct work elements • The sequence in which the elements can be performed is restricted • The line must operate at a specified cycle time (=service time + repositioning time) The Problem: • To assign the individual work elements to workstations so that all workers have an equal amount of work to perform
Assumptions About Work Element Times • Element times are constant values • But in fact they are variable • Work element times are additive • The time to perform two/more work elements in sequence is the sum of the individual element times • Additivity assumption can be violated (due to motion economies)
Work Element Times • Total work content time Twc Twc = where Tek = work element time for element k • Work elements are assigned to station i that add up to the service time for that station Tsi = • The station service times must add up to the total work content time Twc =
Constraints of Line Balancing Problem • Different work elements require different times. • When elements are grouped into logical tasks and assigned to workers, the station service times, Tsi, are likely not to be equal. • Simply because of the variation among work element times, some workers will be assigned more work. • Thus, variations among work elements make it difficult to obtain equal service times for all stations.
Precedence Constraints • Some elements must be done before the others. • Restrictions on the order in which work elements can be performed • Can be represented graphically (precedence diagram)
Example: Grommet : sealant like ring
Example: A problem for line balancing • Given: The previous precedence diagram and the standard times. Annual demand=100,000 units/year. The line will operate 50 wk/yr, 5 shifts/wk, 7.5 hr/shift. Uptime efficiency=96%. Repositioning time lost=0.08 min. • Determine (a) total work content time, (b) required hourly production rate to achieve the annual demand, (c) cycle time, (d) theoretical minimum number of workers required on the line, (e) service time to which the line must be balanced.
Example: Solution • The total work content time is the sum of the work element times given in the table Twc=4.0 min • The hourly production rate • The corresponding cycle time with an uptime efficiency of 96% • The minimum number of workers: w* = (Minimum Integer 4.0 /1.08=3.7)=4 workers • The available service time Ts=1.08-0.08=1.00 min
Measures of Balance Efficiency • It is almost imposible to obtain a perfect line balance • Line balance efficiency,Eb: Eb = Perfect line: Eb = 1 • Balance delay,d: d = Perfect line: d = 0 • Note that Eb + d = 1 (they are complement of each other)
Overall Efficiency • Factors that reduce the productivity of a manual line • Line efficiency (Availability), E, • Repositioning efficiency (repositioning), Er, • Balance efficiency (balancing), Eb, • Overall Labor efficiency on the assembly line =
Line Balancing Algorithms – Heuristics • Largest candidate rule • Kilbridge and Wester method • Ranked positional weights method, also known as the Helgeson and Birne method • In the following descriptions, assume one worker per workstation
Largest Candidate Rule • List all work elements in descending order based on their Tek values; then, • Start at the top of the list and selecting the first element that satisfies precedence requirements and does not cause the total sum of Tek to exceed the allowable Ts value • When an element is assigned, start back at the top of the list and repeat selection process • When no more elements can be assigned to the current station, proceed to next station • Repeat steps 1 and 2 until all elements have been assigned to as many stations as needed
Example: Balance efficicency
Solution for Largest Candidate Rule • Physical layout of workstations and assignment of elements to stations using the largest candidate rule
Ranked Positional Weights Method • A ranked position weight (RPW) is calculated for each work element • RPW for element k is calculated by summing the Te values for all of the elements that follow element k in the diagram plus Tek itself • Work elements are then organized into a list according to their RPW values, starting with the element that has the highest RPW value • Proceed with same steps 1, 2, and 3 as in the largest candidate rule
Other Considerations in Line Design • Methods analysis • To analyze methods at bottleneck or other troublesome workstations • improved motions, • better workplace layout, • special tools to facilitate manual work elements • product design • Utility workers • To relieve congestion at stations that are temporarily overloaded • Preassembly of components • Prepare certain subassemblies off-line to reduce work content time on the final assembly line
Other Considerations - continued • Storage buffers between stations • To permit continued operation of certain sections of the line when other sections break down • To smooth production between stations with large task time variations • Parallel stations • To reduce time at bottleneck stations that have unusually long task times • Worker (Labor) Shifting with crosstraining • Temporary (or periodic) relocation to expedite or to reduce subassembly stocks
Most Follower Rule 3 8 5 1 5 8 4 9 10 3 10 6 5 4 2 7 6 6 4 9 15/19 19 10/19 19 16/19 19 19/19 19