Download
1 / 56
560 likes | 634 Vues
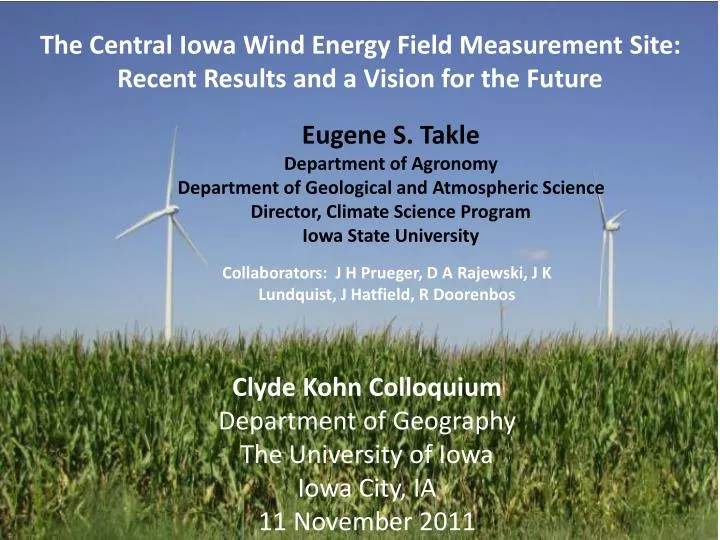
The Central Iowa Wind Energy Field Measurement Site: Recent Results and a Vision for the Future. Eugene S. Takle Department of Agronomy Department of Geological and Atmospheric Science Director, Climate Science Program Iowa State University.

E N D
The Central Iowa Wind Energy Field Measurement Site: Recent Results and a Vision for the Future Eugene S. Takle Department of Agronomy Department of Geological and Atmospheric Science Director, Climate Science Program Iowa State University Collaborators: J H Prueger, D A Rajewski, J K Lundquist, J Hatfield, R Doorenbos Clyde Kohn Colloquium Department of Geography The University of Iowa Iowa City, IA 11 November 2011
Outline: • History and Motivation • Conceptual Model • Field Experiment • Preliminary Results • Low-Level Jet • Wind Shear • 2011 Field Campaign Photo courtesy of Lisa H Brasche
Crop/Wind-energy Experiment (CWEX) Began 2009-2010 as a seed grant funded by the Center for Global and Regional Environmental Research Attracted funding from the Ames Laboratory, DOE Attracted participation by the National Laboratory for Agriculture and the Environment Photo courtesy of Lisa H Brasche
CWEX Motivation: Two Components • Public acceptance of wind turbines • Multi-use, high-land-value environment • Crops are tuned to climate conditions Do changes in temperature, humidity, wind speed, turbulence, and CO2 due to wind turbines influence crop growth and yield? • Testbed for validating high-resolution models of wind-farm performance and coupling to surface and PBL • General understanding of impacts of turbines • Understand turbine-turbine interaction and wind-farm performance • Options for further wind farm build-out: Go higher? More dense? • Iowa has a flat terrain, strong LLJ, not unlike coastal jets, many existing windfarms and component manufacturers: good zero-order testbed for off-shore technologies
What Turbine Density Optimizes Wind Power Production and Agricultural Production?
Turbine-Crop Interactions:Overview • Do turbines create a measureable influence on the microclimate over crops? • If so, is this influence create measureable biophysical changes? • And if this is so, does this influence affect yield? Agricultural shelterbelts have a positive effect on crop growth and yield. Will wind turbines also have a positive effect? Photo courtesy of Lisa H Brasche
Source: UniFly A/S Horns Rev 1 owned by Vattenfall. Photographer Christian Steiness.
Porté-Agel, Lu, and Wu, 2010 Wuβow, Sitzki, & Hahn, 2007, CFD simulation using ANSYS FLUENT 6.3 LES
Conceptual Model of Turbine-crop Interaction via Mean Wind and Turbulence Fields Speed recovery _____________________________________ day H2O CO2 Heat night
CWEX10 Field Experiment • Central Iowa wind farm (200 1.5-MW turbines) • Southern edge of a wind farm • Corn-soybean cropping pattern (measurements made in corn) • 26 June – 7 September 2010; turbines off 0700 LST 26 July – 2300 LST 5 Aug 2300 • 4 Eddy Covariance flux towers • NREL/CU Lidar (J. Lundquist) (28 June-9 July)
CWEX10/11 Instrument Deployment Story II Story I
4 flux towers • maize canopy • 26 June – 7 Sept, 2010 • CU/NREL Lidar • 28 June - 9 July 2010
CWEX10 Data analysis • Focus on ‘differences’ in crop microclimate at flux tower locations • Pay attention to wind direction • Turbines on – turbines off • Isolate instrument and location biases • Reference sonic temperature ~ 0.6-0.8oC high • possible influence from localized advection (large pond and wet field 1 km SE of the reference tower)
Wind speed comparison at 9 m Preliminary South wind: Turbines On NW wind: Turbines On South wind: Turbines Off NW wind: Turbines Off
Wind speed comparison at 9 m Preliminary South wind: Turbines On NW wind: Turbines On Daytime wind speed decrease South wind: Turbines Off NW wind: Turbines Off
Normalized TKE comparison at 6 m Preliminary South wind: Turbines On NW wind: Turbines On More turbulence at night South wind: Turbines Off NW wind: Turbines Off
u’w’ comparison at 6 m Preliminary South wind: Turbines On NW wind: Turbines On Higher nighttime surface stress South wind: Turbines Off NW wind: Turbines Off
Air temperature comparison at 9 m Preliminary South wind: Turbines On NW wind: Turbines On Cooler during day, warmer at night ? South wind: Turbines Off NW wind: Turbines Off
Carbon flux w’CO2’ around peak LAI Preliminary NW W NW W SW W SW W SW S SE Higher carbon uptake by crop behind turbines Higher nighttime respiration behind turbines 9 Jul 10 Jul 10 Jul 11 Jul
CWEX10 Spectral Plots: 27 July 27 1200-1300 Tubines On Tubines Off u’2 Downwind u’2 Upwind Downwind Upwind v’2 v’2 Upwind Downwind Upwind Downwind w’2 Downwind Upwind w’2 Upwind Downwind T’2 T’2 Upwind Downwind Upwind Downwind P’2 Upwind Downwind P’2 Upwind Downwind
Summary • Preliminary analysis seemed to show a measureable influence of turbines on microclimate over crops. However • More in-depth analysis (wavelets, spectral analysis), more days of observation, different overall wind conditions shows more inconsistencies • Not sure that preliminary measurements represent general conditions
1800 LST 2200 LST 0200 LST 0800 LST 1800 LST 2200 LST 0200 LST 0800 LST Height above surface [m] Height above surface [m] Wind Speed [ms-1] Potential Temperature [K] The dynamics of the lower atmosphere are complex, especially at night Radiosonde profiles demonstrate that the cooling of the surface overnight is accompanied by dramatic accelerations in the winds Poulos, Blumen, Fritts, Lundquist, et al., 2002 Julie.Lundquist@nrel.gov
Models Don’t Capture Height of Jet Max Data courtesy of K. Carter and Adam Deppe, ISU Observations Models
Observed wind speed profiles (Windcubelidar, summer, Midwest US) exhibit more variability than is traditionally considered in CFD LLJ Max ~ 16 m/s And these are “typical” midwestern conditions! LLJ Max ~ 12 m/s Turbine Wake Rhodes, Aitken, Lundquist, 2010, 2011 Julie.Lundquist@colorado.edu
Directional Shear of 20o Across the Rotor Disk is Common Considerable nocturnal directional shear And these are “typical” Midwestern Conditions! Rhodes, Aitken, Lundquist, 2010, 2011, Julie.Lundquist@colorado.edu
CWEX11 Field Campaign • Same location • Measure from June-August • Six measurement stations (instead of 4); four provided by National Center for Atmospheric Research • Two lidars (one upwind, one downwind of turbine line) provided by J. Lundquist, CU • Wind Energy Science, Engineering and Policy Research Experience for Undergraduates (REU)students involved
CWEX10/11 Instrument Deployment Story II Story I
Data Analysis: • 5-min averages, differences between downwind and upwind • Carefully selected wind direction where turbine wake is likely • Omitted periods of data with any error flags for the sonic anemometer at any flux station • Create scatter plots of upwind (NCAR1) z/L0 vs. difference field (e.g. w[NCAR2-NCAR1]) • South case has about 2100 observations • North case has about 900 observations
Normalized wind speed difference South (173°-187°) North (341°-18°) Near neutral to slightly stable conditions favor larger over speeding Considerable scatter in day vs. night with north winds
Normalized Turbulence Kinetic Energy Difference South (173°-187°) North (341°-18°) Near neutral to slightly stable conditions favor enhanced turbulence at the down-wind flux towers Similar TKE ahead of and behind wind turbine line, less scatter in strongly stable conditions
Difference in Friction Velocity (u*) South (173°-187°) North (341°-18°) More daytime scatter of u* differences (turbulence from several lines of turbines upwind) Similar to wind speed, increase in night-time shear stress downwind of the turbine line
Difference in Mean Vertical Velocity South (173°-187°) North (341°-18°) Stable stratification suppresses vertical motion downstream of the turbines Enhanced turbulence from several lines of turbines counteracts stability quenching effect of vertical velocity
CASE STUDY: Night 16 Jul 2230-17 Jul 0600 NCAR towers all show over speeding (NCAR2 closest to the rotor) Speedup is greatest farther downstream ISU2 least amount of speed increase Note : ISU wind speed at 8 m vs. 10m for NCAR towers
CASE STUDY: Night 16 Jul 2230-17 Jul 0600 TKE is most enhanced at NCAR2 because of the faster speeds. NCAR4: detection of turbulence from the wake? Nice null-effect of TKE between the two ISU towers NCAR 1 ahead of the rotor has higher turbulence than at ISU 1 in the gap region
CWEX11 REU student short course in field measurements NCAR station records 40 m/s (89 mph)wind on 11 July REU students measure noise levels in the wind farm
A Vision for CWEX13 4H 3H 2H H Story II wind turbines
Porté-Agel, Lu, and Wu, 2010 Wuβow, Sitzki, & Hahn, 2007, CFD simulation using ANSYS FLUENT 6.3 LES
Measurements Needed • Surface fluxes • Horizontal velocity through the turbine layer (H) • Turbulence in the turbine layer with the layer above (H-2H) • Diurnal changes of u, T, RH, turbulence in H-10H • Low-level jet characteristics
Analysis Needed • Surface flux anomalies • Vertical profiles of horizontal velocity through the turbine layer (H) • Coupling of the turbine layer with the layer above (H-2H) • Horizontal convergence in the H layer • Diurnal changes in H-10H • Low-level jet characteristics
Modeling Needed • Diurnal changes of surface fluxes • Coupling of the turbine layer with the layer above (H-2H) • Horizontal convergence in the H layer • Diurnal changes in H-10H • Low-level jet characteristics • Turbine-turbine interactions
Desired Outcomes • Better forecasting capacity for wind farm wind speed • Understanding/forecasting of ramp events • Better understanding of LLJs • Range/limits of possible influences on crops • High-resolution modeling of turbine-turbine interactions • High-resolution modeling of turbine-ABL interactions • CWEX becomes the internationally leading wind farm test bed for validating wind farm simulation models