The Balanced Scorecard
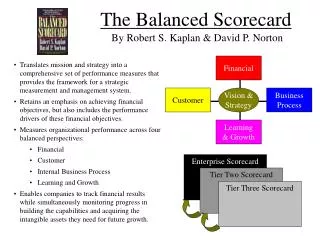
The Balanced Scorecard. ASQ Vermont Section 16 April 2009 presented by Jim Whitney, Champlain College. What is the Balanced Scorecard (BSC)?. Developed in early 90s Robert Kaplan (Renaissance Group) David Norton (Harvard Business School) “Translating Strategy Into Action”

The Balanced Scorecard
E N D
Presentation Transcript
The Balanced Scorecard ASQ Vermont Section 16 April 2009 presented by Jim Whitney, Champlain College
What is the Balanced Scorecard (BSC)? • Developed in early 90s • Robert Kaplan (Renaissance Group) • David Norton (Harvard Business School) • “Translating Strategy Into Action” • Traditional financial measures were • Too narrow – no connection to strategy • Too focused on the past – not predictive • Encouraged tendency to manage qtr to qtr • Too much “what” – Too little “why” ASQ Vermont Section
Balanced Scorecard Library • The Balanced Scorecard (1996) • Strategy-Focused Organization (2001) • Strategy Maps (2004) • Alignment (2006) • Execution Premium (2008) ASQ Vermont Section
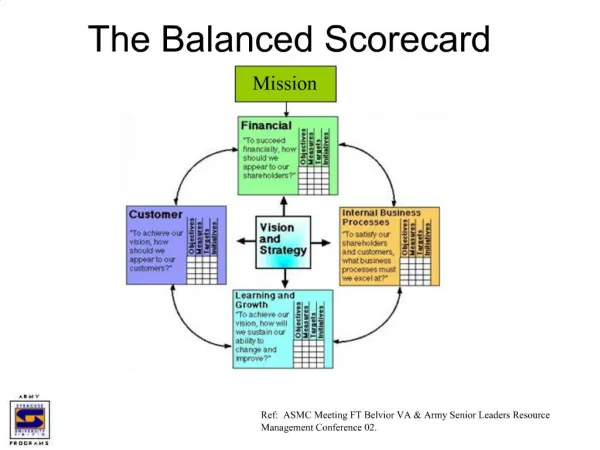
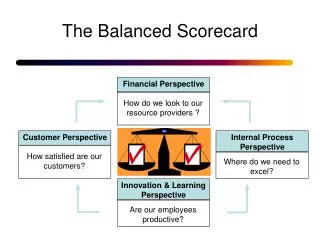
BSC: Four Perspectives • Financial perspective • Customer perspective • Internal Business perspective • Learning & Growth perspective ASQ Vermont Section
BSC strategic focus Sanger, Mark, Supporting the Balanced Scorecard. Work Study, V 47, No 6 ASQ Vermont Section
Example of a Balanced Scorecard ASQ Vermont Section
Financial perspective • Uses traditional tools and reports • Considers EVA© and ROCE • Economic Value Added • NOPAT- (capital x cost-of-capital) • Return on Capital Employed • Emphasizes growth and improvement • Links financial performance to strategy ASQ Vermont Section
Traditional accounting Salaries $375,000 Benefits 92,000 Supplies 47,000 Phone 8,500 Travel 13,000 Total $535,000 Activity Based Costing Select suppliers $82,000 Procure mat’ls 175,000 Certify vendors 92,000 Resolve problems 103,500 Expedite shortages 83,000 Total $535,000 BSC encourages use of ABC Johnson, Christian C., Introduction to the Balanced Scorecard and Performance Measurement Systems, ASQ Vermont Section
Linking Finance to Strategy ASQ Vermont Section
Customer Satisfaction Market Share Customer Profitability Customer Retention Customer Acquisition Customer Satisfaction ASQ Vermont Section
Customer perspective • Market share (various criteria) • Customer retention (absolute or relative) • Customer acquisition (absolute or relative) • Customer satisfaction • Specific performance criteria • Defined value proposition • Customer profitability • Profitability by account • Net of any special account-specific expenses ASQ Vermont Section
Customer perspective • Value proposition typically includes elements of • Time • Quality • Price ASQ Vermont Section
Internal Business perspective • Focus on process improvement • Chose processes aligned with strategy • Identify customer need • Identify the market • Create the product/service offering • Build the products/services • Deliver the products/services • After-sale customer service • Customer need satisfied ASQ Vermont Section
Learning & Growth perspective • Core measurements • Employee productivity • Employee satisfaction • Employee retention • Enablers • Staff competencies • Technology infrastructure • Climate for action/change ASQ Vermont Section
What to measure? • 20-25 measures usually sufficient • ~ 20% of measures usually lack data • No data • No measurement • No management control • No improvement ASQ Vermont Section
Balancing the BSC Heaviest emphasis is on business processes ASQ Vermont Section
BSC and Quality “…the process of self-assessment does not, of itself, improve the organisation… a key step in the process is to identify the ‘ vital few’ [areas of improvement relating to the organization’s strategy]… EFQM Brussels Representative Office, Assessing for Excellence: A Practical Guide for Self –Assessment, 1999 “When this does not happen, the excellence model type quality tools become internally preoccupied, rigid and generally unhelpful. Harari, O., “The eleventh reason why TQM doesn’t work,” Management Review, V 82 No 5 ASQ Vermont Section
Quality Improvement Horizons Andersen, H and G Lawrie, “Effective quality management through third-generation balanced scorecard,” International Journal of Productivity and Performance Management V 53 No 7, 2004 ASQ Vermont Section
Quality Improvement Horizons ASQ Vermont Section
Strategy-linked Continuous Improvement • Strategy maps ID critical processes • Top-down implementation is typical • Use rate-of-change to estimate horizon • Horizon s/b in synch with strategic goals • If not, consider process re-engineering ASQ Vermont Section
BSC and Quality Programs • Symbiotic relationship: “BSC enhances quality programs – it gives focus and clear linkages to improvements in strategic customer and financial outcomes” • Establishes and tests linkages between quality of process and performance ASQ Vermont Section
BSC and Baldridge • Baldrige subcategories mirror BSC: • Customer-focused results • Financial and market results • Human resource results • Organizational effectiveness • Curt Riemann, first Director of Baldrige National Quality Program,attended BSC presentations in early 90s. Changes in Baldrige followed soon after. ASQ Vermont Section
EFQM criteria: Leadership (10%) People (9%) Policy & strategy (8%) Partnerships & resources (9%) Processes (14%) People results (9%) Customer results (20%) Society results (6%) Key perf. results (15%) Baldrige categories Leadership (12%) Human resource focus (8.5%) Strategic planning (8.5%) Process management (8.5%) Customer & market focus (9%) Information & analysis (8.5%) Business results (45%) BSC, Baldrige and EFQM ASQ Vermont Section
Linkages to Strategy • EFQM and Baldrige: implicit • BSC (via strategy maps): explicit • Objectives • Measurements • Targets • Initiatives ASQ Vermont Section
What BSC adds to quality programs • Explicit causal linkages through strategy maps and cascaded objectives • Establishes targets for breakthrough performance (not merely best practices) • Often identifies entirely new processes critical for achieving strategic objectives • Sets strategic priorities for process enhancements • Integrates budgeting, resource allocation, target setting, reporting, and performance feedback into ongoing management processes ASQ Vermont Section
Generic Strategy Map Johnson, Christian C., Introduction to the Balanced Scorecard and Performance Measurement Systems, ASQ Vermont Section
Building strategy maps Requiresconsensus, clarity and commitment to strategy at the executive level Produces • testable hypothesis in strategy • cascading objectives Note implicit application of Theory of Constraints in use of cascading objectives...prevents discontinuous process optimization and optimizes organizational productivity ASQ Vermont Section
Strategy Maps Emphasis on best practices, w/o link to strategy, produces optimal local business processes, but suboptimal support for critical capabilities and strategic initiatives. “BSC starts with strategic priorities and then identifies the process improvements needed to support them.” Quality models may be ad hoc and tactical, producing good local results but lacking a coherent, SBU- and enterprise-level framework ASQ Vermont Section
Strategy linked to operations • Organizations with no systematic process for linking strategy to ops: only 27% as good or better than average of industry peer group • With systematic linking (e.g. BSC): 70% as good or better than industry peers Source: Pateman, Andrew, Business Performance Management, December 2008 ASQ Vermont Section
Strategy linked to operations Kaplan, Robert S and David P Norton, The Strategy Focused Organization, HBSP 2001 ASQ Vermont Section
Alignment Five key principles: • Mobilize change through executive leadership • Translate strategy into operational terms • Align the organization to the strategy • Motivate to make strategy everyone’s job • Govern to make strategy a continual process Four archetypal value propositions • Best total cost (consistent, timely and low cost) • Product leadership (expand performance boundaries) • Customer solutions (custom products/services, know-how) • System platform (platform defines the industry standard) ASQ Vermont Section
Two Faces of Alignment • “Social” side • Communication and teamwork • Understand and support changes needed to pursue agreed-upon strategy • “Technical” side • Integration of diverse operations • Apply six sigma, TQM etc. • Cascade strategy to align processes ASQ Vermont Section
BSC in execution Pateman, Andrew, Business Performance Management, December 2008 ASQ Vermont Section
10 Golden Rules for Implementing a BSC • There are no standard solutions: all business differ • Top management support is essential • Strategy is the starting point • Limited and balanced number of objectives and measures • No in-depth analyses up front, but refine and learn by doing • Take a bottom-up and top-down approach • It is not a systems issue, but systems are an issue • Consider delivery systems at the start • Consider the effect of performance indicators on behavior • Not all measures can be quantified Roest, Pim, Information Management and Computer Security, V 5No 5, 1997 ASQ Vermont Section
Building a BSC with SWOT BSC measures strategic alignment and success, but does not decide or design strategy BSC defines “whats” for QFD in a strategic planning exercise, but does not provide guidance on the “hows” required for strategic management. ASQ Vermont Section
Example of SWOT Incorporating BSC perspectives Source: Lee, SF and Andrew Sai On Ko, Managerial Auditing Journal, 15/1/2 2000 ASQ Vermont Section
Analysis Techniques Compared Tan, B L Development of an e-Business Selection Framework for Manufacturing SMEs: A Study of the Printing Industry. PhD thesis, Aston University, 2005
Using VCA & BSC to develop QFD “hows” Tan, B and D Bennet, “Development and Application of an Electronic-Manufacturing Selection Framework for SMEs” International Journal of innovation and Technology Management V 4 No 3 2007 ASQ Vermont Section
Source: Lee, SF and Andrew Sai On Ko, Managerial Auditing Journal, 15/1/2 2000 ASQ Vermont Section
BSC Success Stories • Cigna Property and Casualty • Losing $1m/day in 1992; BSC introduced in 1993. Became profitable in two years, sold division for $3bn five years later. • Mobil’s US Marketing and Refining Division • Last in industry profitability in 1993, introduced BSC to communicate strategy to newly formed SBUs. Moved from last to first place in industry in two years. • Brown and Root • Introduced BSC in 1992 to assist in post-merger OD. Moved to first place in their industry within three years. ASQ Vermont Section
Performance Prism: Next Generation BSC? ASQ Vermont Section
The Balanced Scorecard ASQ Vermont Section 16 April 2009 Questions?
The Balanced Scorecard ASQ Vermont Section 16 April 2009 Thank you!