Download
1 / 76
770 likes | 955 Vues
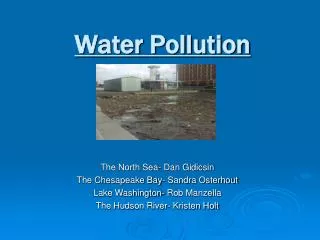
The Chesapeake Bay: How is it Doing?. The Chesapeake Bay: How is it Doing?. December 2005. Why Are We Here?. The Chesapeake Bay is a beautiful place. By protecting the Bay, we are more likely to preserve our economy and the health of the living things that call the Bay home.

E N D
The Chesapeake Bay:How is it Doing? The Chesapeake Bay:How is it Doing? December 2005
Why Are We Here? The Chesapeake Bay is a beautiful place. By protecting the Bay, we are more likely to preserve our economy and the health of the living things that call the Bay home.
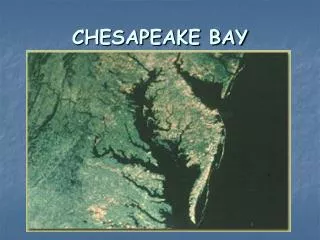
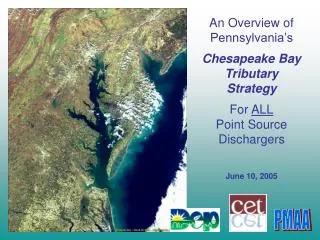
Chesapeake Bay Watershed New York Pennsylvania Maryland Delaware West Virginia District of Columbia Virginia
The Bay is Economically Important The Bay is important for many reasons. It helps to support the region's economy as a major source of seafood and a major hub for shipping and commerce.
The Bay is Important for Recreation and Tourism It offers a wide variety of recreational opportunitiesfor residents and visitors.
The Bay Provides Important Habitat for Wildlife It provides a huge natural habitat for wildlife.
Where Does the Bay Start? Where does the Bay start? If you are one of the 16 million people who live in the watershed, then the Bay starts in your backyard!
Threats to the Bay and Rivers NUTRIENTS SEDIMENTS TOXIC CHEMICALS HABITAT LOSS OVERFISHING
Nutrients Nitrogen and Phosphorus are the nutrients causing problems in the Bay.
What Are the Effects of Excess Nutrients? What are the effects of excess nutrients? Bay grasses die.
Bay creatures are affected by low oxygen levels What are the effects of excess nutrients? Low oxygen levels in Bay waters.
Sources of Pollutants to the Bay Nonpoint Sources • Run-off from farmland • Run-off from lawns and paved areas Point Sources • Industry • Wastewater Treatment Plants
Cows in Streams Stormwater and groundwater carry nutrients into rivers and the Bay from a variety of nonpoint sources.
Wastewater Treatment Plant Point sources are the second largest contributors of nutrient pollution to the rivers and the Bay.
Fossil Fuel Power Plant A significant amount of nitrogen pollution is created when we generate electricity and drive cars. Generating electric power by burning fossil fuels, such as coal and oil, releases nitrogen, in the form of nitrogen oxide gas, into the air.
Automobile Exhaust Nitrogen, again in the form of nitrogen oxide gases, comes out of car tail pipes and gets into the air.
Septic Systems Another source of nitrogen is septic systems. Many homes in the watershed use underground septic systems for treatment of wastewater and sewage.
The Bay and its rivers are doing betterthan they were when the firstChesapeake Bay Agreement was signed in 1983,but we still have a way to go before we reach our goals for a restored Chesapeake.
Phosphorus Concentrations Declining in Some of theNon-tidal Portions of the Rivers Monitoring data shows that concentrations of nitrogen flowing into the Bay are decreasing in many of the Bay’s major tributaries. These charts use flow-adjusted data, which are ‘normalized’ to account for seasonal and year-to-year variability in weather patterns. 1985 – 2004 Decreasing No significant trend Increasing
Nitrogen Concentrations Declining in Some of theNon-tidal Portions of the Rivers Monitoring data shows that concentrations of phosphorus flowing into the Bay are decreasing in many of the Bay’s major tributaries. These charts use flow-adjusted data, which are ‘normalized’ to account for seasonal and year-to-year variability in weather patterns. 1985 – 2004 Decreasing No significant trend Increasing
Sediment Concentrations Declining in Some of theNon-tidal Portions of the Rivers Monitoring data shows that concentrations of sediment flowing into the Bay are decreasing in some of the Bay’s major tributaries. These charts use flow-adjusted data, which are ‘normalized’ to account for seasonal and year-to-year variability in weather patterns. 1980s – 2004 Decreasing No significant trend Increasing
Bay Grasses Show Annual Variation Restoration Goal (185,000 acres by 2010) Underwater bay grasses are slowly improving, but further reductions in the pollutants flowing into the Bay are needed to help them flourish. Annual variations in bay grasses show the sensitivity of the Bay ecosystem. *Note – Hatched area of bar includes estimated additional acreage. No Baywide surveys 1979-83 and 1988 Source: Chesapeake Bay Program.
Rockfish Population Stable Baywide Female Spawning Stock Biomass Rockfish have rebounded to levels not seen since the 1950’s, but concerns remain over disease, sufficient sources of food and availability of spawning habitat. Fishing moratoria: MD & DE: 1985-1990 VA: 1989-1990
Bald Eagle Populations on the Rebound! Actions to control chemical contaminants have led to improved conditions in the Bay. Bald eagles are no longer endangered due to the ban on the pesticide DDT and subsequent habitat improvements.
The Chesapeake Bay Program Partnership Governor of MD Governor of PA Governor of VA Mayor of DC EPA Administrator Executive Council Chair of Chesapeake Bay Commission
Bay Cleanup Has Citizen Involvement CHESAPEAKEBAY PROGRAM Scientific and Technical Advisory Committee Citizen Advisory Committee representing the interests of: Business, Industry, Environment, Agriculture, Fisheries, Local Governments, Developers, etc. ALLIANCE FOR THE CHESAPEAKE BAY CHESAPEAKE BAY FOUNDATION WATERSHED ORGANIZATIONS LAND TRUSTS CONSERVATION GROUPS CHESAPEAKE BAY CLEANUP
Phosphate Detergent Ban After signing the 1983 Bay Agreement , Maryland, Pennsylvania, Virginia and the District of Columbia instituted phosphate detergent bans. In 1987, Chesapeake Bay Program partners committed to achieving a 40 percent reduction in controllable nutrient loads to the Bay by 2000… and in 1992, agreed to stay at or below these nutrient loads once attained.
Chesapeake 2000: The New Agreement In June 2000, the Chesapeake Bay Program partners signed a new agreement to guide the restoration and protection of the Bay through the next decade and beyond. In Chesapeake 2000, the partners agreed to: “by 2010, correct the nutrient‑ and sediment‑related problems in the Chesapeake Bay and its tidal tributaries sufficiently to remove the Bay and the tidal portions of its tributaries from the list of impaired waters under the Clean Water Act”.
2010 Nitrogen Goal 2010 Phosphorus Goal 2010 Sediment Goal Progress toward Meeting Nutrient and Sediment Goals Limited The Chesapeake Bay Program Watershed Model provides program managers with a way to estimate the nutrient and sediment reductions that will likely occur as pollution abatement practices are implemented throughout the watershed. These reduction estimates also provide an indication of the pollutant load that would flow into the Bay in an "average” year. Using the model, managers can project the future response of various management actions put in place today. Based on Bay watershed model simulations, 58% of the phosphorus, 41% of the nitrogen and 54% of the sediment reduction goals have been achieved. Source: CBP Phase 4.3 Watershed Model. Estimates of nutrient and land-based sediment reductions that may occur when the reported management practices and reduction technologies are implemented within watershed portions of NY, PA, MD, DC, DE, WV, VA. The model's nonpoint source load reductions are estimates of what would occur under long-term avergaed rainfall conditions based on the years 1985-1994. The point source load reductions are actual measurements and are influenced by the reporting year’s rainfall.
Wastewater Treatment Improvements 63% of the Point Source Nitrogen Reduction Goal Has Been Achieved Nitrogen loads delivered to the Bay from municipal and industrial wastewater facilities declined 30.4 million lbs/yr 1985 - 2004 as a result of industrial reductions and installment of nutrient reduction technology (NRT) technology. 80% of the Point Source Phosphorus Reduction Goal Has Been Achieved Phosphorus loads delivered to the Bay from municipal and industrial wastewater facilities declined 4.9 million lbs/yr between 1985 and 2004 as a result of improved treatment capability and implementation of phosphate detergent bans (MD: 1985, DC: 1986, VA: 1988, PA: 1990). These reductions occurred in spite of a 20% increase in population 1985-2003.
Best Management Practices As partners in the restoration effort, many farmers are using a variety of techniques, called "best management practices", to reduce nutrients and sediment coming from farms into the Bay and its rivers.
Farmers Using Nutrient ManagementApply Less Nutrients Acres Under Nutrient Management Year 2010 Draft Target: 4.5 million acres 3.42 million acres of cropland and hayland in the Bay watershed were placed under nutrient management plans between 1985 and 2003. The effectiveness of the plans is based on how aggressively they are implemented.
Sediment Control and Stormwater Management The use of sediment control fencing around building and road construction sites has been very successful in reducing nutrient and sediment loads from nonpoint sources.
Restoration and Protection of Habitat and Living Resources Since 1987, the Bay Program has committed to "provide for the restoration and protection of living resources, their habitats, and ecological relationships".
Fish Migration Blockages More than 1,000 miles of fish spawning habitat on Chesapeake Bay tributaries are currently blocked by dams, culverts and other obstructions.
Year 2014 Goal (2,807 miles) Year 2004 Goal Achievement (1,807 miles) Migratory and Resident Fish Habitat Expanding The removal of dams and the construction of fish passages are reopening native spawning grounds to migratory and resident fish in many parts of the watershed. When combined with stocking efforts, migratory species are beginning to return. The removal of dams and fishway construction from 1988 through 2005 reopened 1,838 miles of historic habitat to migratory and resident fish.
Shad Are Starting to Make a Comebackbut Have a Long, Long Way to Go Stocking efforts, a moratorium, and fish passage development increased the number of shad counted at Conowingo Dam from several hundred per year in the early 1980s to an average of 101,140 per year in 2003-2005.
Streamside Forests Sprouting Up Shad Are Starting to Make a Comeback...but have a long, long way to Riparian Forest Buffer Restoration Forest buffer restoration is improving local waterways throughout the Bay watershed by preventing pollutants from entering the rivers and improving wildlife habitat. About 60 percent of the riparian area in the watershed is forested. In 1996, the Bay Program partners committed to restore riparian forests on 2,010 miles of stream and shoreline in the watershed by 2010. This goal was met in 2002. Current 2010 Goal:10,000 miles (established 2003) In 2003, the partners committed to conserve and restore forests along at least 70% of all streams and shoreline in the watershed, with a near term goal of at least 10,000 miles by 2010. Initial 2010 Goal:2,010 miles (established 1996)
Wetlands Are Being Restored Wetland reestablishment and establishment (cumulative acres). 2010 Goal: 25,054 acres GOAL:Achieve a net resource gain by restoring 25,000 acres by 2010 in the Wetlands Restoration Program. STATUS:We have achieved 40% of the wetland acreage gain goal through non-regulatory programs. The Chesapeake Bay Program is working to determine if this is indeed a “net gain”. Establishment: Create wetland that did not previously exist. Reestablishment:Restore historic functions to a former wetland. Data Collection In Progress
Regions of Concern The most severe chemical contamination problems in the Bay are generally limited to those areas located near urban centers close to the Bay: the Baltimore Harbor and the Anacostia and Elizabeth rivers. The Bay Program is directing reduction and prevention actions toward these areas, known as "Regions of Concern". Baltimore Harbor Anacostia River Regions of Concern: Areas with known chemical contaminant-related impacts. Elizabeth River
Status of Chemical Contaminant Effectson Living Resources in the Bay’s Tidal Rivers Chesapeake Bay scientists and managers characterized the status of chemical contaminant effects on living resources in the Bay’s tidal rivers based on all available chemical contaminant data. The result of this characterization, summarized in this map, will be used by Chesapeake Bay Program decision makers to target specific tidal rivers for monitoring and management efforts.
Industry Reduces Chemical Releases Bay basin industries have achieved their voluntary goal of reducing releases and transfers of chemical contaminants 65% between 1988 and 2000. Since the year 2000 goal has been achieved, the Chesapeake Bay Program has consulted with industry to set new targets. Year 2000 Measurement of Progress
Crabs The Chesapeake Bay blue crab fisheries are valuable. They provide significant economic benefits for many people in the region. They are also an important part of the region's heritage.
Blue Crabs At Risk Mature Female Blue Crabs Blue Crab populations have stabilized at below-average levels. Improved water quality and habitat restoration efforts along with proper management of the crab harvest are needed to restore the Bay’s blue crab populations. Average
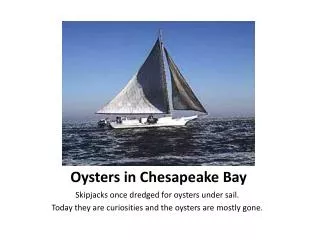
Oysters at Historic Lows Oyster populations in the Chesapeake are at historic lows due to disease, intense harvest pressure and poor water quality.
Oysters and Aquatic Reef Construction Bay Program partners are constructing underwater reefs to provide habitat for oysters and the other animals and plants that rely on these reefs for their survival.
Forest Acreage Declining Forests provide critical habitat and help prevent pollutants and sediment from reaching the Bay and rivers. About 59% of the Bay basin is currently forested. The forest that regrew from the 19th to the mid-20th centuries is steadily declining. Current losses represent permanent conversions.