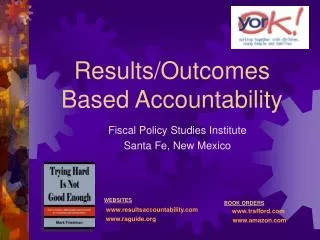
Outcomes Based Accountability
Outcomes Based Accountability. TM. "TURNING THE CURVE". The Fiscal Policy Studies Institute. Websites raguide.org resultsaccountability.com. Book - DVD Orders amazon.com resultsleadership.org. SIMPLE COMMON SENSE PLAIN LANGUAGE MINIMUM PAPER USEFUL.

Outcomes Based Accountability
E N D
Presentation Transcript
Outcomes BasedAccountability TM "TURNING THE CURVE" The Fiscal Policy Studies Institute Websites raguide.orgresultsaccountability.com Book - DVD Ordersamazon.comresultsleadership.org
SIMPLE COMMON SENSE PLAIN LANGUAGE MINIMUM PAPER USEFUL
Population Accountabilityabout the well-being ofWHOLE POPULATIONS For Communities – Cities – Counties – States - Nations Performance Accountabilityabout the well-being ofCUSTOMER POPULATIONS For Services – Agencies – and Service Systems Outcomes-Based Accountabilityis made up of two parts:
Outcome-Based Accountability COMMON LANGUAGE COMMON SENSE COMMON GROUND
THE LANGUAGE TRAPToo many terms. Too few definitions. Too little discipline Benchmark Outcome Result Modifiers Measurable Core Urgent Qualitative Priority Programmatic Targeted Performance Incremental Strategic Systemic Indicator Goal Measure Objective Target Core qualitative strategic objectives Your made up jargon here Measurable urgent systemic indicators Lewis Carroll Center for Language Disorders
OUTCOME or RESULT A condition of well-being for children, adults, families or communities. Population Population INDICATOR or BENCHMARK A measure which helps quantify the achievement of an outcome. PERFORMANCE MEASURE A measure of how well a program, agency or service system is working.Three types: Performance Performance DEFINITIONS OUTCOME 1. Children born healthy, Children ready for school, Safe communities, Clean Environment, Prosperous Economy Children born healthy Children ready for school Clean Environment Safe communities Prosperous Economy INDICATOR 2. Rate of low-birthweight babies Rate of low-birthweight babies, Percent ready at K entry, crime rate, air quality index, unemployment rate Percent ready at K entry crime rate air quality index unemployment rate PERFORMANCE MEASURE 3. 1. How much did we do? 2. How well did we do it? 3. Is anyone better off? = Customer Outcome
Population Performance Customer outcome = Ends Service delivery = Means From Ends to Means From Talk to Action From Talk to Action OUTCOME ENDS INDICATOR PERFORMANCEMEASURE MEANS
POPULATIONACCOUNTABILITY For Whole Populationsin a Geographic Area Fiscal Policy Studies Institute Santa Fe, New Mexicowww.resultsaccountability.comwww.raguide.org
Community Outcomesfor Christchurch, NZ 1. A Safe City 2. A City of Inclusive and Diverse Communities 3. A City of People who Value and Protect the Natural Environment 4. A Well-Governed City 5. A Prosperous City 6. A Healthy City 7. A City for Recreation, Fun and Creativity 8. City of Lifelong Learning 9. An Attractive and Well-Designed City
Every Child Matters – Children ActOutcomes for Children and Young People Being Healthy: enjoying good physical and mental health and living a healthy lifestyle. Staying Safe: being protected from harm and neglect and growing up able to look after themselves. Enjoying and Achieving: getting the most out of life and developing broad skills for adulthood. Making a Positive Contribution: to the community and to society and not engaging in anti-social or offending behaviour. Economic Well-being: overcoming socio-economic disadvantages to achieve their full potential in life.
City of London Ontario, CanadaPriority Results ● A Strong Economy ● A Vibrant Diverse Community ● A Green and Growing City ● A Reliable Infrastructure ● A Safe City Source: Draft Strategic Plan Sept 2011
New Zealand Coventry, UK Halton Ontario Santa Cruz, CA
Leaking Roof(Outcomes thinking in everyday life) ? Fixed Experience Inches of WaterBASELINE Not OK Measure Turning the Curve Story behind the baseline (causes) Partners What Works Action Plan #2 Action Plan
Outcomes Indicators Baseline & Story
Newcastle, UK Nov 08 – Jan 09 8.5 Source: Connexions Tyne and Wear, UK Revised 9 Nov 2007
Christchurch, New ZealandNumber of Graffiti SitesFY 2002 to FY 2010
Performance Accountability For Services, Agencies and Service Systems Fiscal Policy Studies Institute Santa Fe, New Mexicowww.resultsaccountability.comwww.raguide.org
“All Performance Measures that have ever existed for any service in the history of the universe involve answering two sets of interlocking questions.”
Service Performance Measures Quality Quantity HowWell did we do it? ( % ) HowMuch did we do? ( # )
Service Performance Measures Effort How hard did we try? Effect Is anyone better off?
Effort HowWell HowMuch Effect Service Performance Measures
Service Performance Measures Quality Quantity How welldid we deliver it? How much service did we deliver? Effect Effort Output Input How much change / effect did we produce? What quality of change / effect did we produce?
Service Performance Measures Quality Quantity How welldid we do it? How much did we do? Effect Effort Is anyonebetter off? # %
Education Quality Quantity How well did we do it? How much did we do? Student-teacherratio Number ofstudents Effect Effort Is anyone better off? Number of 16 olds with 5 A to CGCSE’s Number of fixedterm exclusions Percent of 16 yr olds with 5 A to CGCSE’s Rate of fixedterm exclusions
#childrenfullyimmunized(in the practice) %childrenfullyimmunized(in the practice) Pediatric Practice Quality Quantity How well did we do it? How much did we do? Percent ofpatients treatedin less than1 hour Number ofpatientstreated Effect Effort Is anyone better off?
Drug/Alcohol Treatment Program Quality Quantity How well did we do it? How much did we do? Percent ofstaff withtraining/certification Number ofpersonstreated Effect Effort Is anyone better off? Number of clientsoff of alcohol & drugs- at exit - 12 months after exit Percent of clientsoff of alcohol & drugs- at exit - 12 months after exit
Fire Department Quality Quantity How well did we do it? How much did we do? ResponseTime Number ofresponses Effect Effort Is anyone better off? # of fireskept toroom of origin % of fireskept toroom of origin
Not All Performance Measures Are Created Equal Quality Quality Quantity How well did we do it? How much did we do? LeastImportant Least AlsoVery Important Effect Effort Is anyone better off? MostImportant Most
The Matter of Control Quality Quantity How well did we do it? How much did we do? MostControl Effect Effort Is anyone better off? LeastControl PARTNERSHIPS
% Common measures e.g. client staff ratio, workload ratio, staffturnover rate, staff morale, % staff fully trained, % clients seen in their own language,worker safety, unit cost % Activity-specific measures e.g. % timely, % clients completing activity, % correct and complete, % meeting standard % Skills / Knowledge (e.g. parenting skills) # % Attitude / Opinion (e.g. toward drugs) # Point in Timevs.2 Point Comparison % Behavior (e.g.school attendance) # % Circumstance (e.g. working, in stable housing) # Performance AccountabilityTypes of Measures found in each Quadrant How well did we do it? How much did we do? # Clients/customers served # Activities (by type of activity) Is anyone better off? # %
LR UR Baseline & Story Primary v. Secondary Direct v. Indirect Internal v. External
THE LINKAGE Between POPULATION and PERFORMANCE POPULATION ACCOUNTABILITY Healthy BirthsRate of low birth-weight babiesStable FamiliesRate of child abuse and neglectChildren Ready for SchoolPercent fully ready per K-entry assessment PERFORMANCE ACCOUNTABILITY POPULATIONRESULTS Contributionrelationship Alignmentof measures Child Protective Services # ofinvestigationscompleted % initiatedwithin 24 hrsof report Appropriateresponsibility # repeatAbuse/Neglect % repeatAbuse/Neglect CUSTOMERRESULTS
OBA in a Nutshell2 – 3 - 7 2 - kinds of accountability Population accountability Performance accountability plus language discipline Outcomes & Indicators Performance measures 3 - kinds of performance measures. How much did we do? How well did we do it? Is anyone better off? 7 - questions from ends to means in less than an hour. Baselines and Turning the Curve
“If you do what you always did,you will get what you always got.” Kenneth W. JenkinsPresident, Yonkers NY NAACP
THANK YOU ! Websites raguide.orgresultsaccountability.com ------Book - DVD Orders------amazon.comresultsleadership.org