Download

1 / 40
430 likes | 728 Vues
Science and Technology Indicators of Sri Lanka . Sri Lanka. Dr. P.R.M.P. Dilrukshi Science and Technology Policy Research Division National Science Foundation Sri Lanka www.nsf.ac.lk dilrukshi@nsf.ac.lk. Presentation Layout . Country Profile

E N D
Science and Technology Indicators of Sri Lanka Sri Lanka Dr. P.R.M.P. Dilrukshi Science and Technology Policy Research Division National Science Foundation Sri Lanka www.nsf.ac.lk dilrukshi@nsf.ac.lk
Presentation Layout • Country Profile • History of R&D data collection in Sri Lanka • Present status of collecting R&D statistics • Summary of R&D indicators of Sri Lanka • Usage of S&T indicators in the country • Problems faced by Survey team during the R&D survey Science and Technology Policy Research Division, National Science Foundation, Colombo 7 , Sri Lanka. www.nsf.ac.lk
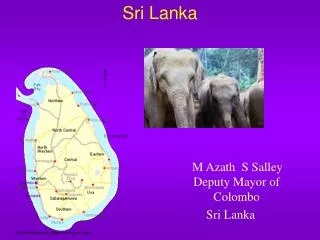
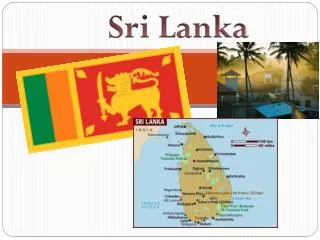
Country Profile • Democratic Socialist Republic of Sri Lanka, known as Ceylon before 1972, is an island in South Asia, located about 31 kilometers (19.3 mile) off the southern coast of India. • Total land area is 65,610 square km • Mid year population in 2008 is 20.2 million • Female: Male ratio (2002) 52:48 • Density of population, person per sq. km. 322 • Average Literacy rate 91. 3% (male: 92.8, Female 77.9) • Infant mortality rate (per 1000 live births) 11 • Maternal mortality rate (per 100,000 live births) 58 • Expectation of life at birth, 71.9 years • Human Development Index (2007) : 102 (Rank among 182 countries) • Prosperity Index (2007): 0.759 Science and Technology Policy Research Division, National Science Foundation, Colombo 7 , Sri Lanka. www.nsf.ac.lk
History of R&D data collection in Sri Lanka • The mandate to collect S&T statistics was provided to the National Science Council (NSC) of Sri Lanka the predecessor of National Science Foundation in 1967. • The earliest study on S&T indicators was carried out in 1970 to assess the scientific resources in Sri Lanka in term of public expenditure on Research and Development by the Ceylon Institute for scientific & industrial Research (CISIR) predecessor of Industrial Technology Institute (ITI) • A subsequent survey was conducted to measure the Scientific and technical manpower in the country in 1972 by the Ceylon Association for the Advancement of Science presently known as the Sri Lanka Association for the Advancement of Science (SLAAS). Science and Technology Policy Research Division, National Science Foundation, Colombo 7 , Sri Lanka. www.nsf.ac.lk
History of R&D data collection in Sri Lanka contd. • The first systematically designed survey on scientific and technical manpower potential in the country was carried out in 1974 by the National Science Council (NSC) following the guidelines prepared by the UNESO. • In 1977 National Science Council (NSC) carried out it’s 2nd major survey which included an assessment of funding for basic and applied research in the country for 10 year period from 1956 to 1965 and technical manpower during 1977. Science and Technology Policy Research Division, National Science Foundation, Colombo 7 , Sri Lanka. www.nsf.ac.lk
History of R&D data collection in Sri Lanka • The 3rd study of the series was carried out in 1984 by the Natural Resource Energy Authority (NARESA) which was the successor of NSC and predecessor of National Science Foundation (NSF). Science and Technology Policy Research Division, National Science Foundation, Colombo 7 , Sri Lanka. www.nsf.ac.lk
History of R&D data collection in Sri Lanka contd. • The 4th comprehensive survey carried out by NARESA in 1996 covering higher education, government, industrial and private non profit sectors. This is the first comprehensive survey of R&D in the country and done according to the standard specified by OECD Frascati Manual. • The 5th Survey was carried out in year 2000 by the NSF the successor to NSC and NARESA. The survey only covered the higher education sector and S&T public sector following the UNESCO guidelines and OECD Frascati Manual. Science and Technology Policy Research Division, National Science Foundation, Colombo 7 , Sri Lanka. www.nsf.ac.lk
Present status of collecting R&D statistics in Sri Lanka • After establishment of Science and Technology Policy Research Division at the NSF the regular R&D survey commenced in 2006 covering all Science and Technology sectors. • The R&D survey conducted biannually. • Accordingly three surveys completed in 2006, 2008 and 2010 to measure the status of R&D in the country pertaining to 2004, 2006 and 2008 respectively. Science and Technology Policy Research Division, National Science Foundation, Colombo 7 , Sri Lanka. www.nsf.ac.lk
Present status of collecting R&D statistics in Sri Lanka Contd. • Preliminary preparation are being made to carry out survey for 2010 and survey planned to commenced on April 2011 Science and Technology Policy Research Division, National Science Foundation, Colombo 7 , Sri Lanka. www.nsf.ac.lk
National Research Experiment and Development Survey Sri Lanka (R&D Survey) • Conduct Every two Years • Data collection done according to the fiscal year (survey start on 31st March of the survey year) • Follow OECD (Frascati and Canbara Manuals) and UNESCO definitions and standard Science and Technology Policy Research Division, National Science Foundation, Colombo 7 , Sri Lanka. www.nsf.ac.lk
Scope of the Survey • All higher education Sector Institution • All R&D Institutions • All government and private sector Institutions work in the areas in Science and Technology • All S&T service sector organizations including Ministries, Department, Statutory Boards etc. • Business enterprise sector (Select representing sample only) • Non Profit Private sector organizations and Non Government organizations Science and Technology Policy Research Division, National Science Foundation, Colombo 7 , Sri Lanka. www.nsf.ac.lk
Survey Methodology 5 types of questionnaires use to collect data as follows: 1. Higher Education 2. R&D Institute/Units/Individual doing R&D 3. S&T service sector 4. Business sector enterprises 5. Non Profit Local/Foreign Organizations Science and Technology Policy Research Division, National Science Foundation, Colombo 7 , Sri Lanka. www.nsf.ac.lk
Data collection Methodology Higher Education Sector: • MOU has been singed with University Grant Commission (UGC) to collect data pertaining to the government university system in 2006 • UGC is provided with questionnaires and relevant definitions and guidelines for the data collection. • The survey frame include all Faculties, Department , Institutions, units comes under the S&T sector Science and Technology Policy Research Division, National Science Foundation, Colombo 7 , Sri Lanka. www.nsf.ac.lk
Data Collection Methodology Contd. • Private sector Higher Education Institutes, all R&D Institutes, S&T service sector institutes and other government institutions involve in S&T activities are collected by NSF/STPRD staff by visiting the institutions and following a. Direct interview method b. Training appointed person from the particular institution and collecting information through that contact person (An honorarium payment is made to this contact person) c. Directly employing questionnaire mailing method and giving guidelines for data collection through e-mail/over the phone • Non profit sector data collection: is done by the staff of the STPRD/NSF though direct interview method and questionnaire mailing method. Science and Technology Policy Research Division, National Science Foundation, Colombo 7 , Sri Lanka. www.nsf.ac.lk
Data collection Methodology Contd. Business Enterprise sector data collection: • Outsource data collection to the Department of Census and Statistics Sri Lanka. • Data collection done through direct interview method by enumerators trained by the NSF Staff. • Survey frame selected proportionately representing all Industrial categories. • Only 250 industries selected to conduct the survey. • Data collection completed within two months period. Science and Technology Policy Research Division, National Science Foundation, Colombo 7 , Sri Lanka. www.nsf.ac.lk
Collecting Data of S&T Human Resources Data collection done through two questionnaires 1. Human resources involve in R&D (Researchers, Technicians /equivalent staff and Supporting staff) 2. Human resources involve in S&T related activities (S&T Scientists, Technicians and Supporting staff directly involve in S&T service activities ) Science and Technology Policy Research Division, National Science Foundation, Colombo 7 , Sri Lanka. www.nsf.ac.lk
Calculatting R&D Personnel (FTE) • Method employed: Number of days spend on R&D work per week by person is asked in the questionnaire. If a person do work related to R&D more than 4 hours per day it taken as one day. If it is less than 4 hours that taken as ½ a day. Accordingly, the time spend on R&D per week is calculated and from that percentage of time per month on R&D work is calculated. This extrapolated for a different institutions and average number of person in each category working fulltime calculated accordingly. Science and Technology Policy Research Division, National Science Foundation, Colombo 7 , Sri Lanka. www.nsf.ac.lk
Status of Sri Lankan S&T Science and Technology Policy Research Division
Indicators Developed 1. Input indicators in term of investment, expenditure and human resources in S&T. 2. Output indicators in term of publications, patent and innovation • Measure S&T statistics in two terms Science and Technology Policy Research Division
Indicators of R&D Expenditure Science and Technology Policy Research Division, National Science Foundation, Colombo 7, Sri Lanka. www.nsf.ac.lk
Gross Expenditure on R&D (GERD) in Sri Lanka 1966-2008 Science and Technology Policy Research Division, National Science Foundation, Colombo 7 , Sri Lanka. www.nsf.ac.lk
Gross Expenditure on R&D Science and Technology Policy Research Division, National Science Foundation, Colombo 7 , Sri Lanka. www.nsf.ac.lk
National expenditure on R&D by source of funding Source: R&D Survey 2008 Science and Technology Policy Research Division, National Science Foundation, Colombo 7 , Sri Lanka. www.nsf.ac.lk
National Expenditure on R&D 1996-2008 Source: R&D Survey 2008 Science and Technology Policy Research Division, National Science Foundation, Colombo 7 , Sri Lanka. www.nsf.ac.lk
National Expenditure on R&D by sector 2004-2008 Percentage of Expenditure Year Source: R&D Survey 2008 Science and Technology Policy Research Division, National Science Foundation, Colombo 7 , Sri Lanka. www.nsf.ac.lk
National expenditure on R&D (GERD) by nature of research activities 2004-2008 Source: R&D Survey 2008 Science and Technology Policy Research Division, National Science Foundation, Colombo 7 , Sri Lanka. www.nsf.ac.lk
GERD by Discipline Source: R&D Survey 2008 Science and Technology Policy Research Division, National Science Foundation, Colombo 7 , Sri Lanka. www.nsf.ac.lk
S&T Human Resources Science and Technology Policy Research Division, National Science Foundation, Colombo 7 , Sri Lanka. www.nsf.ac.lk
Science and Technology Personnel (STP)2004-2006 STP Include all Scientists a Technologists, Technicians, Supporting Staff involve in S&T research, Service and Management activities Source: R&D Survey 2008 Science and Technology Policy Research Division, National Science Foundation, Colombo 7 , Sri Lanka. www.nsf.ac.lk
Number of R&D Scientists and Technicians (Head counts) by Sector 2006-2008 Source: R&D Survey 2008 Science and Technology Policy Research Division, National Science Foundation, Colombo 7 , Sri Lanka. www.nsf.ac.lk
Distribution of R&D scientists (FTE) by Sector 2004-2008 Source: R&D Survey 2008 Science and Technology Policy Research Division, National Science Foundation, Colombo 7 , Sri Lanka. www.nsf.ac.lk
Performance Indicators for Science and Technology Science and Technology Policy Research Division, National Science Foundation, Colombo 7 , Sri Lanka. www.nsf.ac.lk
Number of patents registered in Sri Lanka 1997-2008 Source: R&D Survey 2008 Science and Technology Policy Research Division, National Science Foundation, Colombo 7 , Sri Lanka. www.nsf.ac.lk
Publications trends in the SCI journals by Sri Lankan Scientists in 2004-2008 Source: R&D Survey 2008 Science and Technology Policy Research Division, National Science Foundation, Colombo 7 , Sri Lanka. www.nsf.ac.lk
Use of S&T Indicators in Sri Lanka S&T Indicators use by: • National Science Foundation for selecting priority • areas for funding R&D, human resource development, • facilitating Industry Institute partnership (IIP) and • technology transfer activities etc. • S&T Policy Planning activities and formulating • S&T strategic plan by the Ministry of Research and • Technology. Science and Technology Policy Research Division, National Science Foundation, Colombo 7 , Sri Lanka. www.nsf.ac.lk
Use of S&T Indicators in Sri Lanka • Use by Ministry of Finance & Planning for devoting funds for S&T activities and human resource development. • Use by higher education sector for human resource training. • Use for academic purposes. • STPRD/NSF submit data to UIS since 2004. Science and Technology Policy Research Division, National Science Foundation, Colombo 7 , Sri Lanka. www.nsf.ac.lk
Problems associated with collecting information for R&D Survey • Lack of awareness of people on the importance of having S&T statistics and lack of inadequate knowledge to use it for planning purposes etc. • Reluctance of the people to give information specially concerning budgetary information. Science and Technology Policy Research Division, National Science Foundation, Colombo 7 , Sri Lanka. www.nsf.ac.lk
Problems associated with collecting information for R&D Survey • Difficulty in demarcating boundaries between R&D, Innovation and manufacturing in the industrial sector. • Difficulty in categorizing industries into the disciplines use in higher education, S&T Service and R&D sectors (e.g. natural science, Engineering Technology etc.). Science and Technology Policy Research Division, National Science Foundation, Colombo 7 , Sri Lanka. www.nsf.ac.lk
Acknowledgments • UNESCO Institute of Statistics • UNESCO Kathmandu • Ministry of Science and Technology, Nepal • Director and Management Board of the National Science Foundation • Head/ Science and Technology Policy Research Division Science and Technology Policy Research Division, National Science Foundation, Colombo 7 , Sri Lanka. www.nsf.ac.lk