Download
1 / 17
170 likes | 383 Vues
Tests of Association (Proportion test, Chi-square & Fisher’s exact test) Dr.L.Jeyaseelan Dept.of Biostatistics Christian Medical College Vellore, India. Is particular medicine more effective than another?

E N D
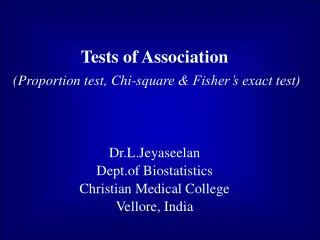
Tests of Association (Proportion test, Chi-square & Fisher’s exact test) Dr.L.Jeyaseelan Dept.of Biostatistics Christian Medical College Vellore, India
Is particular medicine more effective than another? • Researcher would be interested in studies involving comparison of groups, say, Rx A vs. Rx B. • Chance variation • Effect variation • OUTCOME: Cure / Not Cure
Proportion Test What is our interest? Rx A cure rate Vs Rx B cure rate
Null hypothesis: The hypothesis of “no difference” or no effect” in the population is called null hypothesis. Cure rate in Rx A group = Cure rate in Rx B group Research (or) Alternative hypothesis: Research hypothesis states that there is difference. Treatment A Treatment B
Procedure & Steps • Find the type of problem and the question to be answered • State the Null Hypothesis • State the research Hypothesis • Selection of the appropriate test to be utilized • Fixation of the level of significance • Calculating the critical ratio • Comparing the calculated value with the table value (CV>TV p<0.05 significant). • Making inferences.
Proportion of people cured in A (p1)= x1/n1 = 20/393 = 0.051 Proportion of people cured in B (p2)= x2/n2 = 6/322 = 0.019 Where p <0.05 Conclusion: There is a significant difference between RxA and RxB with respect to their cure rates.
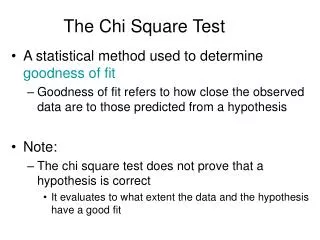
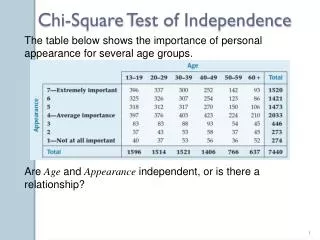
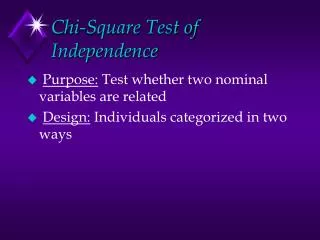
Chi Square Test To test the association between two qualitative variables when the data is in the form of counts. Null hypothesis : There is no association between two variables Alternative hypothesis : There is association Example: TB TB Prophylaxis in HIV
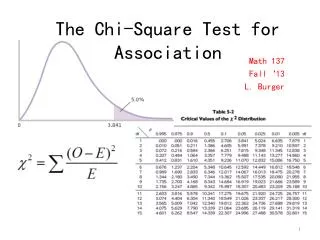
In a four fold table we can obtain an index that computes for each cell. Sum (observed count – expected count )2 expected count where the expected count is obtained by row total X column total grand total
Alive Dead 20 (5.1%) E1=393x26 715 373 (94.9%) E2=393x689 715 393 Less Care 6 (1.9%) E3=322x26 715 316 (98.1%) E4=322x689 715 322 More Care 26 689 Example: Considering a hypothetical data where we want to find association between prenatal care received by mother and survival status of infants at one month. 715
Chi-square for continuity correction Continuity correction is always advisable although it has most effect when the expected numbers are small.
Fisher’s Exact Test • Exact test is recommended when • the overall total of the table is less than 20 or • the overall table is between 20 to 409 and the smallest of the four expected numbers is less then 5
Comparison of two treatment regimes for controlling bleeding in hemophiliacs undergoing surgery Complication Treatment Fisher’s exact P value = 0.322
McNemar’s Chi-Square test (Paired Case) • In some studies, researcher is interested in comparing two proportions which are paired • This arises whenever two proportions are measured on the same individuals from matched pair design • McNemar’s Chi-Square test is based on the numbers of discordant pairs
Layout and test statistic for matched pair analysis is Test 2 + ve - ve e + ve Test 1 f - ve g n h
Paired data • In a study to compare a new method with an established method for the culture of tubercle bacilli, each of 320 specimens was tested by the two methods. The new method detected 96(30%) positives and the established method 80(25%).
McNemar’s test with the continuity correction Established method 2=(|18-2| -1)2 / (18 + 2), which yields a chi-square of 11.2 with 1 d.f. This is significant (p<0.001) and demonstrates that the new method is more sensitive than the established method in detecting tubercle bacilli. New method