Download

1 / 26
280 likes | 483 Vues
Scaling and Animal Abundance. Isn’t ecology the study of the factors that affect the abundance of animals?. Scaling and ecology vs. scaling and individuals. The individual implications of scaling can take on a different form.

E N D
Scaling and Animal Abundance Isn’t ecology the study of the factors that affect the abundance of animals?
Scaling and ecology vs. scaling and individuals • The individual implications of scaling can take on a different form. • Excretion, ingestion, growth, and reproduction are physiological processes that scale to body size. • When applied to a population of animals they can become nutrient regeneration, prey mortality, and production.
Community structure • Sheldon, Prakash, and Sutcliffe (1972) found that when marine communities are divided into logarithmic size classes, the amount of matter in each class is approx. constant. (Remember that if metabolism and abundance have relationships with (body size)^(3/4) and (body size)^(-3/4) this is true) • Bacteria biomass = whale biomass • Biomass =7,200(individual body mass)^(-1) • Number individuals = 7,200(individual body mass)^(-2) • Number of species = 230 (individual body mass)^(-1) • But all of the numbers kind of sketchy
Other studies • Schwunghamer (1981) tested model to marine benthic communities. There were 3 biomass peaks, which correspond to bacteria, meiofauna, and macrofauna. • This makes sense and is predictable. But there was not constant biomass across all logarithmicly increasing size classes. • Schwinghamer suggested that a given environment would favor some parts of the spectrum, but that there would still be no trend in overall logarithmic size classes. • Janzen and Schoener (1968) found nearly constant biomass across insect communities divided into logarithmic length classes. • Side note: may be evidence that connects the size of organisms to resource availability (limited resources = more small organisms) • Overall = sketchy • Need more research
Mean density • Not well studied • Mohr (1947) found that per unit area, the number of animals in a species (all North American mammal) is inversely proportional to their body mass. So biomass per unit area is constant • Damuth (1981) suggests that global herbivore density decreases as W^(-.75) • A few other studies show a similar decrease in density with size.
Differences among organisms • Temperate mammals maintain higher population densities than tropical species • Herbivores have higher density than carnivores • Non-mammalian species show significantly different relationships • But all data could be described by a curve of slope -1, is this very general relationship better than more specific ones from smaller data sets? • Note: People still unsure of what the slope should be…
Home range • We can test the population density numbers by comparing them with data for home ranges. • If the population densities are good, home range (how much area an organisms wanders around) should be close to the inverse of population density. • Area used by animals ~ area/animals (individual area used by animal) • Empirical evidence supports population density numbers (but not perfect of course)
Energy flux • (Population density) x (individual energy use) = rate at which population consumes energy from the environment • NP = R • Who claims more of the ecosystem production?
Depends on stability of environment • In stable ecosystems, Sprules and Munawar (1986) found in more ‘stable’ ecosystems, smaller organisms consumed more of the ecosystem energy. • But in more ‘unstable’ ecosystems larger organisms used more of the energy. • Stable = self-sustainable, ocean or large, oligotrophic ( not many plants = good for animals because decomposition uses oxygen) • Unstable = shallow lakes/coastal zone, eutrophic (opposite of oligotrophic), subject to major discharges of nutrients/contaminents
More studies • Biddanda et al. (2001) had similar results. In the most stable aquatic ecosystems, bacteria control 91-98% of energy. In highly eutrophic water, bacteria respiration only accounts for 9%. • Li (2002) found that the ratio between population densities of the smallest phytoplankton and the largest grew with ecosystem stability. In most stable ecosystem, the exponent B of the power law ~ -4/3. In unstable, B ~ -1/3. • Damuth (1993) got results for terrestial animals and found that closed ecosystems had more negative B values than open systems (-.88 +/- .31 vs. -.50 +/- .40)
Which means… • If R is dependent on body mass, ecosystems dominated by smaller organisms will be more stable • If energy flux is constant, a lot of small organisms are more stable than a few big ones • Example: Better to have your money in many investments than one
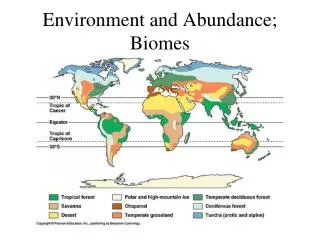
What about plants? • Plants like trees can be huge because most of their mass (wood) is not metabolically active. Their leaves/needles take care of the metabolism. • If we judge plants by their number of leaves… Whittaker (1975) found that conifers (needles) dominate boreal forests, rather than grasses and deciduous trees.
Allometric Simulation Models • We can use computers to ‘make’ an ecosystem that runs on allometric models! • These help us predict qualitative transfers of mass through time by using a few allometric equations • Ii = 0.0059Wi^-.25 Gi = 0.0018Wi^-.25 • Ri = 0.0018Wi^-.25 Di = 0.0023Wi^-.25 • Those are ingestion, production, respiration, and defecation • Note: for poikilotherms Allometric? -->
A simple model • There are five different groups of organisms of mass W (.1, 1, 10, 100, and 1000 g.) • Each group starts with some biomass B • There is this mystical food pool from which all of the organisms get their energy. This is related to their ingestion, I • They give back to the mystical pool in relation to the mortality, M • They maintain their population in relation to their production, G • All of the energy ‘lost’ in the form of defecation and respiration goes to a magical pool of detritus, which then gives back to the food pool such that there is no energy loss in the system.
Things to keep in mind • The energy flow is whack-tastic • There are no primary producers • So the system would just die down because of respiration and defecation • To compensate the detritus pool puts back into the food pool, so it basically represents poop, plants, and all the animals not shown in the model.
On food • The trophic relations are interesting • Ingestion is determined by size and biomass, this food is drawn from ALL classes through a function for mortality in relation to the class’ abundance • Mi = [(Bi^F)/∑(Bi^F)] ∑Ii Where F is arbitrary constant • So the amount of total food a population demands is taken from everybody else’s death. The more of you there are, the more die. • Total ingestion therefore = Total mortality • So all organisms eat the same food…so there are no trophic levels in relation to body size. This model implies that dietary differences within and between the sizes is not too important • Other models try to have trophic levels so that larger animals always eat the next smallest class.
What does the model say? • Firstly, let’s look back at the equation: Mi = [(Bi^F)/∑(Bi^F)] ∑Ii • Remember F? Well when F=1, mortality loss is directly proportional to abundance. But since small things are more sex-hungry, they will rapidly dominate the system. • We need a way to give small populations more protection from predators and have large populations contribute a lot to the food pool. • When F > 1, all of the size classes persist. Larger values of F leads to larger representation by big animals. But small sizes always dominate.
F! A, B, C are F = 1, 2, and 3
What the F more can it do? • As F goes up: • Total biomass goes up • Diversity goes up • Average body size goes up • Top line is biomass • Middle line is size diversity • Bottom line is average size
So how does the model compare? • Well it qualitatively agrees with observed trends in succession for everything that the model can predict (but not necessarily a good test… this is still unreliable) • Biomass, individual size, and size class diversity increase over time • Bigger organisms are more resistant to dramatic changes in the environment
Cope’s Law • Larger soecies tend to appear later in a group’s phylogeny • That means, large animals usually started out as small animals • Exceptions are for some birds and amphibians, which are now smaller, and also really big animals which are now extinct • Some theorize that this is because large body size is a desirable trait that is selected over evolutionary time (more control over environmental effects so less likely to be eaten, dessicated (no water), die from temperature, and starve) • Plus big animals are more mobile, better vision, higher fecundity for poikilotherms (more offspring for animals that don’t control body temp),larger offspring, increased capacity to learn, and more specialization
Explanations of Cope’s Law • But for all of the advantages, many people cite complementary disadvantages and debate whether larger animals really do have it better off (more parasites, predators have fewer prey, may not really be more specialized). • So let’s just say being small is just as good as being big. • Stanley (1973) rephrased Cope’s law to ask why many evolutionary lines started off as small species. He found that over evolutionary time, maximum size does increase within taxa. But the medium and minimum sizes are not affected. • This suggests that being big really isn’t better • So the real question may be, why did so few species become big • The easy answer is that most potential ancestors were small. This is because perhaps being big is a very specialized trait, and they are so specialized that they are poor potential ancestors and there aren’t many big things to begin with.
Small Species and Big Species • Small species are more likely to produce new lines because: • There are more of them • They have smaller geographic ranges and less mobility, so it is easier to be isolated geographically • Small species produce more offspring, so their will be more heterogeneity • They have higher absolute mortality (more selection) • Large species evolve more slowly because: • Lower rates of speciation • High rates of extinction • Longer generation times, low population numbers, specialized habitat • Of course, people disagree! Maybe the evolutionary rates are the same, but big species have higher extinction rates because of fewer niches
How useful are these relationships? • Well…how often do people study two organisms that are in different logarithmic size groups? • The relationships break down when comparing things of similar size (maybe because large size differences dominate over more specific traits governing abundance) • There are too many factors! Body size scaling would be sweet. • A whole paper talked about how our methods for determining population were poor because of how we determine our census area. • Read Brown et al. (2004)…next week.Lots of people have problem with his work and the abundance - body size relationship being legit or try to show that there is no strong mechanism (energy).
So like normal… • Size and abundance relationships could be interesting • Too bad we don’t have great data • Too bad we don’t have a reliable mechanism • Too bad there are conflicting views and numbers