Energy Balance and Weight Control
730 likes | 1.38k Vues
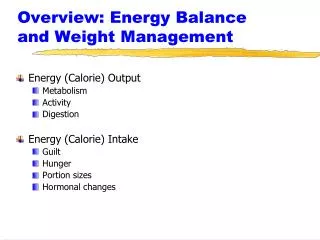
Energy Balance and Weight Control. Dr. David L. Gee FCSN 245-Basic Nutrition. Energy Balance. EB = E(in) - E(out) E(in) = dietary intake of energy E(out) = energy expenditure. Energy Balance: The Key to Weight Change. When E(in) < E(out) Negative energy balance weight loss

Energy Balance and Weight Control
E N D
Presentation Transcript
Energy Balance and Weight Control Dr. David L. Gee FCSN 245-Basic Nutrition
Energy Balance • EB = E(in) - E(out) • E(in) = dietary intake of energy • E(out) = energy expenditure
Energy Balance:The Key to Weight Change • When E(in) < E(out) • Negative energy balance • weight loss • When E(in) > E(out) • Positive energy balance • weight gain • When E(in) = E(out) • Zero energy balance • no weight change
How do you measure:Energy (in) • Calories = • energy required to heat 1 kg water by 1 degree C. • Bomb Calorimeter
©2001 Brooks/Cole, a division of Thomson Learning, Inc. Thomson Learning™ is a trademark used herein under license.
How do you measure: E(out) • Direct Calorimetry • measures heat directly • bomb calorimeter (for food) • room calorimeter • Indirect Calorimetry • measures oxygen consumed or • carbon dioxide produced
The effects of energy imbalance are cumulative!! • If: +EB of 100 Cal/day • Eat an additional cookie/day • = +EB of 36,500 Cal/year • If 1 lb fat = 3500 Cal • Then see wt gain of 10 lbs per year !!! • 36,500Cal/year / 3500 Cal/lb fat • Therefore, knowing what affects energy balance is important • Small consistent daily changes can accumulate to cause large weight changes
Energy Out • Components of E(out): • Basal Metabolic Rate (BMR) • Activity (Act) • Thermic Effect of Food (TEF) • E(out) = BMR + Act + TEF
Basal Metabolic Rate • Energy essential for life support • Circulation • Respiration • Temperature Maintenance • Nerve Transmission • Kidney Function, etc
Basal Metabolic Rate • Estimation of BMR: • BMR = 0.9 - 1 Cal / kg BW / hr • Example: • 120 lbs / 2.2 lbs/kg = 55 kg • BMR = 55 x 1 x 24hr/d • BMR = 1320 Cal / day
Basal Metabolic Rate • Factors affecting BMR • Age • BMR declines 2% per decade • Height • BMR related to body surface area • Growth • BMR highest during periods of growth • Body Composition • Lean tissue has higher metabolic rate than fat tissue
Basal Metabolic Rate • Factors affecting BMR • Fever • Increases by 7% per degree F. • Stress • Increases with physical stress (disease/trauma) • Undernutrition • Decreases with low calorie intake
Energy for Activity • Sedentary (adds 25-35% of BMR) • Light (35-50%) • Moderate (50-70%) • Heavy (>70%) • Example: • Light Activity = 40% x 1320 = 530 Cal • Moderate Activity = 60%x1320= 790 Cal • Sedentary = 30%x1320= 396 Cal • Change from Moderate to Sedentary Activity • = gain 41 pounds of fat per year!!
Thermic Effect of Food • Increased energy expenditure after a meal. • 5-10% of BMR • Cost of digestion, absorption, & assimilation of nutrients • Ex: 5% x 1320 = 60 Cal
Estimation of E(out) • E(out) = BMR + Act + TEF • Example: • E(out) = 1320 + 530 + 60 = 1910 Cal • BMR = 69% of E(out) • Act = 28% of E(out) • TEF = 3% of E(out)
Healthy Weight and the Non-Diet Approach David L. Gee, PhD Professor of Food Science and Nutrition Central Washington University
Prevalence of Overweight in the US • 1990: 56% of Americans were overweight • 23% were obese • 2000: 64% of Americans were overweight • 30% were obese • At this rate • In 2010: 73% overweight • In 2020: 84% overweight • In 2030: 96% overweight • Increases in overweight/obesity were seen in: • Both males and females • All age groups • All ethnic groups
The increase in prevalence in people with BMI > 25 was almost Entirely due to increased prevalence of obese!!! Overweight may be a transitional state for most Americans !!!
Epidemic Increase in Childhood Overweight, 1986-1998JAMA 286:2845-2848 (2001) • National Longitudinal Survey of Youth • 1986-1998 • 8,270 children, aged 4-12 yrs • Prior studies show it took 30 years for overweight prevalence to double. Current study show doubling time to be less than 12 years. • Rate of increase particularly high in African American and Hispanic children
Epidemic Increase in Childhood Overweight, 1986-1998JAMA 286:2845-2848 (2001)
Prevalence of overweight in children. • CDC (2004) • Overweight = above the 95th percentile for BMI based on NHANES II data from 1970’s • For adolescents 12-19 yrs: • 1974 = 7.4% • 2002 = 15.6% • Recent UW report (2007) that up to 25% of WA children are overweight.
Genes/Biology vs Environment • Overweight is a result of both • Adoption studies (biology) • Adopted adults have BMI that are more similar to biological parents than to adoptive parents. • Animal studies (biology) • genetically obese rats and mice • Genes identified & biology explained
Genes/Biology vs Environment (cont.) • Migration studies (environment) • Japanese • Hawaiian Japanese • Californian Japanese • Dietary Change Studies (biology and environment) • SW Native Americans
Pima Indians • Mexican Pima Indians • subsistence farming & ranching • 20% fat diet, 40 hrs/wk physical work • Arizona Pima Indians • mechanized agriculture, sedentary lifestyle • 40% fat diet
Pima Indians • Arizona Pima Indians are: • 1 inch taller • 57 pounds heavier • 70% obese • 50% with diabetes by age 35
Genes vs Environment: Conclusions • Genes for weight gain predisposes some individuals towards weight gain. • Environment determines which of those individuals actually gain weight.
Why lose weight? • Obesity is associated with greater risk of: • Diabetes • Hypertension & stroke • Coronary heart disease • Most cancers (except lung cancer) • Sleep apnea, arthritis, gall stones, …. • Overfat vs Underfit ???? • Good question! • In reality: Vast majority of overfat are underfit
The Cost of ObesityHealth Affairs, Aug 2006 $336 billion 2005 total Medicare expenses
What is a “Healthy Weight”? • A broad range of weight which allows for minimal risks for chronic diseases. • Goes beyond using only body weight as a criteria for good health.
Determination of your "healthy weight". • Step 1. Body Mass Index • BMI = BW(kg)/Ht2(m2) • Dr. Phil • from Nutrition Action Health Letter, Jan. 2004 • 6‘4" = 78" x 0.0254(m/in)= 1.93m • 240lbs / 2.2(lb/kg) = 109kg • BMI = 109/(1.932)=109/3.72 • = 29.3
BMI Classifications • BMI = 19 - 25 => Desirable • BMI = 25 - 30 => Overweight • BMI = 30 - 35 => Obese, category 1 • BMI = 35 - 40 => Obese, category 2 • BMI > 40 => Severe obesity • “Healthy weight is a broad range of weight…” • For 5’10”, BMI 19-25 • = 132 – 174 lbs
Is BMI a good screening tool for weight problems? • BMI measures degree of overWEIGHT • BMI does not directly measure overFATNESS • But…. • Strong population-based relationship between high BMI and morbidity and mortality • BMI a good predictor of overfatness in middle-aged and older Americans
Healthy Weight (cont.) • If your BMI > 25, then consider presence of other health risk factors.
Healthy Weight (cont.) • Body Fat Distribution • upper body fatness associated with higher health risks • Waist Circumference (1998 NIH) • > 35” for females, • > 40” for males
Healthy Weight (cont.):Know your blood lipids! • Hyperlipidemia/dyslipidemia • TC > 240 mg/dl • LDL-C > 160 mg/dl • HDL-C < 40 mg/dl • TG > 200 mg/dl
Healthy Weight (cont.):Know your blood pressure! • High Blood Pressure • Systolic BP > 140 mm Hg or • Diastolic BP > 90 mm Hg or • Borderline or Pre-hypertensive • >130/85
Healthy Weight (cont.):Know your blood sugar and history • Hyperglycemia (Diabetes) • Fasting Blood Glucose • > 126 mg/dl • Impaired Glucose Tolerance • Pre-diabetic • >110 mg/dl • Gestational Diabetes • Family History of Diabetes
Healthy Weight Summary • If your BMI is 19-25, you are at a Healthy Weight. • Health problems are not weight related • If your BMI is > 25 and you have no other risk factors, you are at a Healthy Weight. • If your BMI is > 25 and you have one or more risk factors, you are NOT at a Healthy Weight. • Weight loss is likely to improve your health
Should everybody who is overweight try to lose weight?Will weight loss improve your quality of life?A Prospective Study of Weight Change and Health-Related Quality of Life in Women • JAMA Dec. 1999 • Nurse’s Health Study • 40,098 women, 4 yr longitudinal study • Weight changes • Quality of life questionnaire • Physical function • Vitality • Freedom from bodily pain • Mental health
The effect of weight gain/loss on:Vitality Score • Weight gain: • associated with declines in vitality scores in all BMI categories • Weight loss • associated with improved vitality scores only in women with BMI>25
The effect of weight gain/loss on:Mental Health Score • Weight gain • associated with a decline in mental health scores in all weight categories • Weight loss • associated with improved mental health scores only in obese class I women and declined in normal weight women.
A Prospective Study of Weight Change and Health-Related Quality of Life in Women.Conclusions: • For women at all BMI categories: • Don’t gain weight • Reduced quality of life • For overweight and obese women: • Weight loss is generally associated with improved quality of life • For normal weight women • Weight loss does not improve quality of life • May actually reduce quality of life