Energy Balance and Weight Control
510 likes | 664 Vues
Energy Balance and Weight Control. Reed A Berger MD Visiting Clinical Professor Nutrition. Energy Balance. -Body weight is determined by the balance between body requirements and energy intake -total energy expenditure (TEE) depends on: 1) BMR, REE, RMR 2) DIT

Energy Balance and Weight Control
E N D
Presentation Transcript
Energy Balance and Weight Control Reed A Berger MD Visiting Clinical Professor Nutrition
Energy Balance • -Body weight is determined by the balance between body requirements and energy intake • -total energy expenditure (TEE) depends on: • 1) BMR, REE, RMR • 2) DIT • 3) exercise/physical activity
Definitions in Energy Metabolism • Calorie: Amount of heat required to raise the temp of 1 g H20 from 14.5 to 15.5 C (in nutrition, deal with 1000 calories or a kcal) • Energy balance: Attained when intake equals total energy expenditure (TEE) and body stores are stable • Thermogenesis: Heat production associated with ATP hydrolysis. Synonymous with energy expenditure or caloric expenditure
Definitions in Energy Metabolism, con’t. • Energy expenditure: The amount of energy used by the body for a given function or activity
BMR (basal metabolic rate) REE (resting energy expenditure) RMR (resting metabolic rate)
BMR, REE, RMR • -BMR is determined by 02 consumed and c02 produced • -it’s measured most accurately under controlled conditions—when pt is under post-absorptive (no food intake for at least 12 hours), is lying down, very relaxed, preferably very shortly after awakening from sleep in the morning, at a comfortable room temp
REE • -in contrast to BMR, REE isn’t measured under basal conditions—it is at rest and in a comfortable environment, but no fasting needed
REE vs. BMR -for these reasons, REE is usually higher than BMR (about 10%) -REE is about 65-75% of daily TEE (total energy expenditure)
Determinants of RMR—first component of energy expenditure • Body composition • Thyroid function • Sympathetic Nervous System function
-basal metabolism depends on the rate of 02 consumption and depends on lean body mass • -affected by the ratio of body cell mass to less active body components such as fat and by changes in proportions (ex: aging—fat increases as lean body mass decreases leading to a decreased BMR) • -bone and muscle have much lower metabolic activity than organs, but much higher metabolic activity than adipose tissue
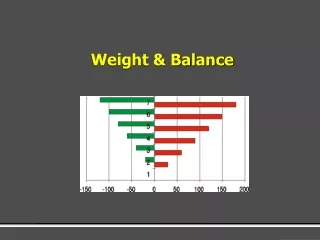
Body Composition:LBM Major Determinant of RMR Male BMI 25 Female BMI 25 20% Fat 30% Fat 30% Extracellular 25% Extracellular Viscera FFM 80% FFM 70% Viscera LBM 50% Skeletal Muscle (BCM) LBM 45% Skeletal Muscle (BCM)
LBM and RMR • LBM determines RMR – fundamental tenet in energy metabolism • Differences in body size and thus RMR are explained by differences in LBM • The differences in RMR observed between ages, gender, races are corrected if adjusted for LBM
In adults, BMR and RMR most closely associated with lean body mass • adipose tissue mainly triacylglycerol and has relativley low O2-consuming activities • on basis of nonlean body weight or surface area, there is significant difference (10%) in BMR for women compared to men • women 0.9 kcal/kg/hr • men 1.0 kcal/kg/hr
This difference reflects higher average proportion of body fat in women vs men (~ 25% vs 15%, respectively) • Because of body fat component, BMR values based on total body weight are lower (0.9 - 1.0 kcal/kg/hr) than those based on lean body mass (~ 1.3 kcal/kg/hr)
Body tissues do not contribute equally to BMR • brain & liver total ~ 4% of body weight yet consume >40% of basal state O2 (18 - 22% for liver alone) • muscle constitutes up to 40% of body weight, but accounts for only ~ 25% of basal energy needs
Variables having effect on BMR Variables of note include • age • gender • pregnancy or lactation • stress • hormonal status • illiness or injury • smoking
Smoking increases BMR • Cessation of smoking lowers BMR • Thyroid status may be most important factor and can make differences of up to plus or minus 50% for hyperthyroidism or hypothyroidism, respectively
Note: BMR given in kcal/hr/m2, i.e., as function of body area in square meters Fig. 8.2. BMR as a function of age
Sources of Energy: • Exogenous: • Food: Fat (9kcal/g) > Protein (4kcal/g) > CHO (3.4kcal/g) • Endogenous: • Adipose Tissue (total 15 kg or 135,000 kcal) • Glycogen (total = 1200 kcals) • Protein stores (gluconeogenic reserve for brain and RBCs during starvation)
Energy Balance and Body Weight Regulation • Energy Balance is tightly regulated by a complex and highly integrated system of sensors (fat depot size, nutrient intake and gastric distension) • Over-consumption of food is countered, to some extent and in some individuals more than others by facultative thermogenesis (i.e., compensatory metabolic events) and by changes in activity • In humans, facultative thermogenesis plays a minor role and is far outweighed by the effects of food composition (caloric density - - fat content) and non-hunger related drives to eat • Understanding these systems is essential for the understanding of current and new treatment options for obesity
Regulation of Energy Balance • Satiety Mechanisms • Central • Peripheral Environmental Factors • Food composition • Food accessibility • Non-hunger related eating Thermogenic Regulation • RMR • Activity • Facultative Thermogenesis Intake Output
Energy Balance Equation • TEE = RMR + TEF + AEE • Body weight = intake – output (TEE) Precision of body weight regulation: Assume daily TEE = 2000 kcal/day (For weight stability intake of food must not exceed or be less than TEE) yearly TEE = 730,000 kcal! If regulation is off by 3500 kcals (0.5% of yearly TEE) gain or lose 1 lb
Diet Induced Thermogenesis (DIT) • -also known as the thermic effect of food • -2nd component of energy expenditure • -metabolic response to food • -work associated with digestion, absorption, transport, metabolism, and storage of energy from ingested food • -5-15% increase in energy expenditure over BMR (usually about 10% of the caloric value of a mixed diet within 24 hours) • -reaches max 1 hour after eating and goes back to zero 4 hours post-prandially
Physical Activity and Exercise • -the third component of energy expenditure • -the most variable component • -also the most easily altered of all the components • -accounts for 20-40% of the TEE, but is much less in a sedentary person and much more in a physically active pt • -includes intensity, duration, and frequency of the activity, the body mass of the person, efficiency at performing the activity, and extraneous factors
Activity • Daily Activity – Activity consumes calories in proportion to expenditure: • Bedridden 10-20% above RMR (200-400kcals) • Marathon runners ~5000 kcals • Mountain climbers ~10,000 kcals • Energy expended with repeated activities declines over time due to enhanced efficiency • Resistance training builds muscle and increases LBM and therefore increases RMR
Measurement of Energy Expenditure • -Direct calorimetry—measures direct heat from the body • -this method is usually very $$ and cumbersome for pts • -therefore, BMR is usually measured indirectly—indirect calorimetry (IC) • -IC measures consumption of 02 and expiration of c02
RQ • -respiratory quotient • -amt of heat produced • -RQ: c02 expired / 02 inhaled • -RQ=1 suggests CHO is being oxidized • -RQ<1 (0.7) suggests fat because it is less oxidized • -RQ=0.8 suggests protein because of the more complicated oxidation of AA (requires removing N and some 02 and C as urea)
Examples • -RQ of a mixed diet of CHO, fat, protein is 0.85 • -clinically an RQ<0.8 suggests underfeeding • -RQ<0.7 suggests starvation of ingestion of a low CHO or high ETOH diet • -RQ>1.0 suggests lipogenesis is occurring (intentional overfeeding)
-clinically, this is important because many pulmonary diseases are worsened by work of expelling C02 produced from energy metabolism---so, for these pts, need to give them a fuel with a lower RQ and less CO2 produced (use higher fat formula with RQ-0.7 vs. CHO-1.0 or protein-0.8)
Energy Intake and Regulation • -food consumption is influenced by other factors in addition to energy expenditure • -there are internal and external factors • -newborns are an example of individuals whose appetite is probably regulated solely by internal control • -as people age, food becomes associated with rituals • -even the smell and sight of food gets the digestive process started
GI peptides • -released for the GI tract to the brain to affect appetite • -somatostatin and cholecystokinin (CCK) provide satiety signals • -bombesin acts alone to inhibit hunger and acts to stimulate CCK which with glucagon has a synergistic effect on satiety
Neurotransmitters • -also regulate food intake • -opiods and neuropeptide Y are primary stimulants of food intake • -galanin stimulates food intake • -serotonin and corticotropin releasing factor (CRF) decrease appetite • -nutrients and their metabolic products also influence appetite
Hormones • -insulin released from the pancreas and levels rise in the blood and CSF after eating to stimulate hunger • -but increased levels in the brain stem stimulate satiety by allowing tryptophan to cross the BBB > serotonin > stimulate satiety and suppress NE and opiods (both which stimulate food intake)
Thyroid Function: Effects on RMR • Hyperthyroidism increases RMR • Hypothyroidism decreases RMR • Early in the 20th Century Measurements of RMR were used to diagnose thyroid disease
The Role of the SNS in Energy Balance • Drug Effects • SNS stimulation (b3-agonists, terbutaline) increase RMR • SNS inhibition (a and b-blockers, propranolol) have no effect on RMR
-balance and wt control require that energy intake = energy expenditure • -obesity lecture: BMI, IBW • -prevalence of obesity is increasing esp in children • -to be discussed in peds obesity lecture
Weight Loss Rate and Composition • -first few days: wt loss is rapid and about 70% water with about 25% from fat and 5% from water • -after about 3 wks: wt loss is slower with 85% from fat and 15% from protein • -wt loss regardless of duration is a combination of lean body mass and fat
-restriction in calories results in a decrease in BMR • -for each kg of wt loss with a hypocaloric diet, energy expenditure is decreased by approx 20 kcal • -reduction in weight decreases the energy cost of physical activity and then slows down the rate of wt loss • -despite all the above, it is still very difficult to predict how much weight each individual will lose
-energy conservation occurs in response to a diet and repeated caloric restrictions • -these restrictions result in the body becoming very efficient in the use of food • -as a result, each time wt reduction is attempted, wt comes off more slowly and with refeeding, wt is gained more rapidly—”yo-yo effect” • -the above is why fad diets don’t work because weight maintenance is much more important than weight loss
The Set Point Ad lib Ad lib
Facultative Thermogenesis:The set point theory explains compensatory metabolic changes with over and under feeding
CNS Control of Food Intake • Brain lesioning studies performed 60 years ago implicated the hypothalamus as the feeding center • Paraventricular hypothalamic nucleus (PVN) = satiety centerablation results in hyperphagia and obesity • Lateral hypothalamic area (LHA) = hunger center ablation results in anorexia and weight loss • Recent data indicates that these centers are highly integrated with brainstem centers mediated by nerves that produce serotonin, norepinephrine and dopamine.
University of North Carolina study on food portion sizes • -between 1977 and 1996, portion sizes for food groups grew in the US • -not only fast-food restaurants, but also in homes and restaurants • -reason for the rise in obesity in US children and adults • -study occurred in JAMA (January 22-29. 2003) • -study performed by doctoral student Samara Joy Nielsen and Dr Barry M. Popkin, professor of nutrition at UNC school of public health and medicine
-research involved analyzing data from 1977-78 Nationwide Food Consumption Survey and Survey of Food Intake by individuals • -sample consisted of 63,380 people ages 2 and older • -between 1977 and 1996, portion sizes increased for salty snacks, desserts, soft drinks, fruit drinks, french fries, hamburgers, cheeseburgers, and Mexican food • -the quantity of salty snacks increased by 93 calories or 0.6 ounces, soft drinks by 49 calories or 6.8 ounces, hamburgers by 97 calories or 1.3 ounces, french fries by 68 calories or 0.5 ounces, and Mexican food by 133 calories or 1.7 ounces
-many problems come from “super-sizing” of foods that allow consumers to get a significantly larger size portion of food for a small additional cost • -this increase in caloric intake along with a more sedentary lifestyle increases the risk of heart disease, stroke, HTN, DM • -also found large increases in the eating of snacks—in 1977, snacks provided 11.3% of the average American’s energy intake, while in 1996, the figure had increased to 17.7%--more than a 50% increase