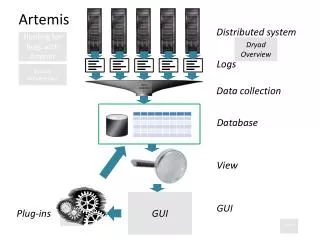
The Artemis Comparison Tool ACT
The Artemis Comparison Tool ACT. Comparative Genomics. It might be expected that if two organisms diverged from a common ancestor, they should share: - similar gene content - similar gene organization However, genome evolution is a highly dynamic process:

The Artemis Comparison Tool ACT
E N D
Presentation Transcript
Comparative Genomics • It might be expected that if two organisms diverged from a common ancestor, they should share: - similar gene content - similar gene organization • However, genome evolution is a highly dynamic process: - gene acquisition and gene loss will change genome content - gene rearrangements will change the order of genes. • Comparative genomics tell us about common and unique features between different organisms at the genome level. • Identification of similarities and differences between genomes may allow us to understand: - How two organisms evolved - Why certain organisms cause diseases while others do not
Representing sequence similarity/identity MQALL… …RHP Region sharing similarity (BlastP) MAVV… …RHP
Orthologue of E. coli b0170 Orthologue of E. coli b0169 Orthologue of E. coli b0171
Genome 1 Genome 2 Region of Synteny
Genome 1 Genome 2 Rearrangements
Genome 1 Genome 2 Insertion or deletion
Whole genomes Chromosomal rearrangements Pathogenicity islands/prophages Gene acquisition and loss Gene rearrangements Pseudogenes Phase variation Single nucleotides
Whole genomes: S. typhi vs. E. coli SPI-10 SPI-2 SPI-1 SPI-9 SPI-7 Vi S. typhi DNA matches E. coli
Multiple genomes B. pertussis IS elements B. bronchiseptica prophage B. parapertussis IS elements
Mu50 N315 MRSA252 MSSA476 MW2 Multiple genomes
Pathogenicity islands/prophages tRNA-Phe type IV pilus sopE Vi antigen S. typhi E. coli
Gene acquisition and loss Insect toxin Y. pestis Y. enterocolitica
Pseudogenes S. typhi secreted effector protein (type-III) S. typhimurium
T. annulata BlastN & TBlastX T. parva Synteny:T.annulata and T. parva (Chr2)
T. annulata & T. parva comparison (Chr 3) • Synteny • Genus-specific expansion • Species-specific expansion • Species-specific genes
P. falciparum vs P. knowlesi: break in synteny P. falciparum Chrl3 P. knowlesi
Improving gene prediction with ACT P. falciparum chr13 P. knowlesi Comparison between orthologous genes in P. falciparum and P. knowlesi
ACT comparison: 3 malaria species P. yoelii P. falciparum P. knowlesi
“species-specific” genes at interruptuions in synteny Plasmodium falciparum Plasmodium knowlesi Plasmodium yoelii
Generating ACT comparison files ACT supports three different comparison file formats: 1) BLAST version 2.2.2 output: The blastall command must be run with the -m 8 flag which generates one line of information per HSP. 2) MEGABLAST output: ACT can also read the output of MEGABLAST, which is part of the NCBI blast distribution. 3) MSPcrunch output: MSPcrunch is program for UNIX and GNU/Linux systems which can post-process BLAST version 1 output into an easier to read format. ACT can only read MSPcrunch output with the -d flag. Here is an example of an ACT readable comparison file generated by MSPcrunch -d. 1399 97.00 940 2539 sequence1.dna 1 1596 AF140550.seq 1033 93.00 9041 10501 sequence1.dna 9420 10880 AF140550.seq 828 95.00 6823 7890 sequence1.dna 7211 8276 AF140550.seq 773 94.00 2837 3841 sequence1.dna 2338 3342 AF140550.seq The columns have the following meanings (in order): score, percent identity, match start in the query sequence, match end in the query sequence, query sequence name, subject sequence start, subject sequence end, subject sequence name. The columns should be separated by single spaces.