High Performance Computing at SCEC
High-Performance Computing (HPC) plays a critical role in simulating earthquakes and their impacts on regions. At the Southern California Earthquake Center (SCEC), HPC enables large-scale simulations of seismic events, predicting ground shaking effects from significant earthquakes. This advanced computational approach utilizes large machines with multiple processors to achieve rapid calculations for Probabilistic Seismic Hazard Analyses (PSHA) and detailed earthquake scenarios. The results directly inform building codes and safety standards, impacting billions in construction annually.


High Performance Computing at SCEC
E N D
Presentation Transcript
High Performance Computing at SCEC Scott Callaghan Southern California Earthquake Center University of Southern California
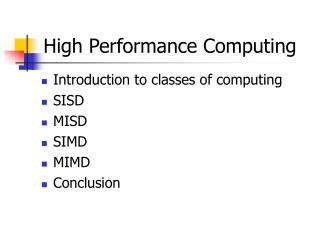
Why High Performance Computing? • What is HPC? • Using large machines with many processors to compute quickly • Why is it important? • Only way to perform large-scale simulations • Two main types of HPC SCEC projects • What kind of shaking will this eq cause in a region? • What kind of shaking will this single location experience?
SCEC Scenario Simulations • Simulations of individual earthquakes • Determine shaking over a region caused by a single event (usually M > 7) Peak ground velocities for a Mw8.0 Wall-to-Wall Scenario on the San Andreas Fault (1Hz) calculated using AWP-ODC on NICS Kraken.
Simulating Large Events • Must break up the work into pieces • Most commonly, spatially • Give work to each processor • Run a timestep • Communicate with neighbors • Repeat • As number of processors increases, harder to get good performance
Probabilistic Seismic Hazard Analysis • Builders ask seismologists: “What will the peak ground motion be at my new building in the next 50 years?” • Seismologists answer this question using Probabilistic Seismic Hazard Analysis (PSHA) • PSHA results used in building codes, insurance • California building codes impact billions of dollars of construction yearly
PSHA Reporting • PSHA information is relayed through • Hazard curves (for 1 location) • Hazard maps (for a region) 2% in 50 years 0.6 g Curve for downtown LA Probability of exceeding 0.1g in 50 yrs
PSHA Methodology Pick a location of interest. Define what future earthquakes might happen. Estimate the magnitude and probability for each earthquake, from earthquake rupture forecast (ERF) Determine the shaking caused by each earthquake at the site of interest. Aggregate the shaking levels with the probabilities to produce a hazard curve. Repeat for multiple sites for a hazard map. Typically performed with attenuation relationships. 7
CyberShake Approach • Uses physics-based approach • 3-D ground motion simulation with anelastic wave propagation • Considers ~415,000 rupture variations per site • 7000 ruptures in ERF • <200 km from site of interest • Magnitude >6.5 • Add variability • More accurate than traditional attenuation methods • 100+ sites in Southern California needed to calculate hazard map LADT: Probability of Exceedance (SA 3.0) Blue and Green – common attenuation relationships Black – CyberShake
Results Attenuation map CyberShake map
Results (difference) CyberShake map compared to attenuation map Population Density
Some recent numbers • Wall-to-wall simulation • 2 TB output • 100,000 processors • CyberShake • Hazard curves for 223 sites • 8.5 TB output files • 46 PB of file I/O • 190 million jobs executed • 4500 processors for 54 days