Download
1 / 8
100 likes | 349 Vues
Financial Applications of Neural Networks. Lecture 3 Some General Principles and a STT Analysis Example. Trading/Investing. Long term (investing) Medium term (investing/trading) Short term (trading) No-nos Fees Commissions Slippage Taxes. Investing Strategies.

E N D
Financial Applications of Neural Networks Lecture 3 Some General Principles and a STT Analysis Example
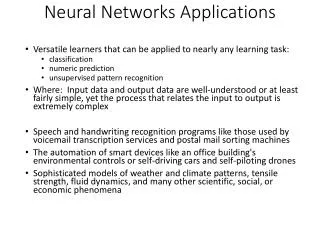
Trading/Investing • Long term (investing) • Medium term (investing/trading) • Short term (trading) • No-nos • Fees • Commissions • Slippage • Taxes
Investing Strategies • Know the primary trend of the marketIf the market or a stock is in a downtrend, it will be difficult to make money. • Diversity. Consider at least 3-4 different areas. • Cut losses early. Use mental stops rather than automatic stop losses.
Investing Strategies • Let profits run. If a stock rises, sell if it falls back a predetermined percentage. • Don ‘t be emotional about about investments. Set stop points and stick to them.
STT Analysis Example The following picture shows a graph of AMAT (Applied Materials Corporation) taken from a typical quote screen. This graph is from Quote.com. The graph shows price for the period, as well as three technical indicators which are useful in predicting price movement in the short term (days to weeks). The technical indicators are OBV, MACD and momentum, and are standard indicators used by most analysts. Definitions and a discussion of the use of these indicators can be found in many places. See, e.g., www.bigcharts.com. These data are some of the inputs for the computer analysis we use in our automatic data analysis programs using neural networks and fuzzy sets. Take a look at the graph and then go to the following slide.
AMAT Graph Discussion Let’s focus on the price movement at the end of August. The price weakness is signaled by the downward crossing of the fast (blue) moving average and the slow (red) moving average in the MACD graph. It is also signaled by the drop in the momentum graph, although this signal is a bit late. However the MACD signal occurred early enough to avoid the subsequent loss in the value of the stock. Because AMAT is a strong company it might have been prudent to buy it back at the following MACD crossing in early October. But remember, in early October we could not know that there was not going to be another terrorist attack. In this case, strict adherence to a MACD crossover trading policy would have been OK, but notice how current events can interfere with automatic trading rules.
AMAT Graph Discussion Let’s consider the timing issue more closely. The graph shows that the downward crossover occurs after a peak, and at that time you might have thought that the stock would not drop further. This behavior is typical. One of the most interesting challenges of automatic trading programs is to attempt to factor other factors into the analysis, in an attempt to anticipate price movement. In fact, this will be one of the major design goals in our work in this course.