Environmental Racism
200 likes | 612 Vues
Reminder: Midterm distributed on Tuesday No groups– work must be alone. Environmental Racism. Do governments, firms, and individuals discriminate against the poor and racial minorities?. 1. Introduction.

Environmental Racism
E N D
Presentation Transcript
Reminder: Midterm distributed on Tuesday No groups– work must be alone. Environmental Racism Do governments, firms, and individuals discriminate against the poor and racial minorities?
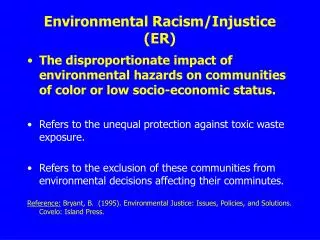
1. Introduction • “Environmental Racism refers to those institutional rules, regulations, and policies of government or corporate decisions that deliberately target certain communities for least desirable land uses…it is the unequal protection against toxic and hazardous waste exposure…” (Bryant, 1995)
Some definitions: LULUs • LULUs: toxic waste sites, bus depots, solid waste transfer stations, airports, sewage treatment facilities, recycling centers, etc.
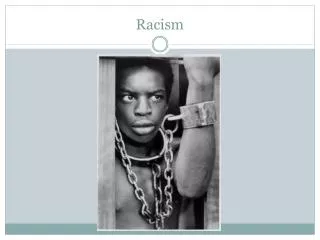
Early movements: • 1967 University of Houston riots over the death of an African American girl at a garbage dump that was located in the middle of a predominantly African American neighborhood • Early 1980s protests over the landfilling of PCBs and oil-toxics in Warren County, North Carolina (mostly African American population)
More recent action: • The 1987 United Church of Christ Commission for Racial Justice’s Toxic Wastes and Race in the United States “shows that communities of color are disparately impacted by the nation’s environmental, industrial, and land use policies” • All of these events point to discrepancies in the local, state, and federal permitting process that allow facilities to locate and pollute (disproportionately,) in minority and low-income neighborhoods
2. Motivation • The “Chicken vs. Egg” controversy – the traditional environmental racism model only looks at a point in time, developing correlations between pollution levels and racial composition • This doesn’t answer the question, because firms may only be locating based on cost…
a) Research question: Is there discrimination, or are we merely experiencing an edogeneity problem where firms (and people) are locating in the least expensive places? • b) Policy questions: Have zoning regulations targeted (or allowed firms to target) minority populations, or those that lack a “voice” in the political arena?
Previous Literature • Alesina, et al, 1999 QJE article “Public Goods and Ethnic Divisions”: Results show that the shares of spending on public goods in U.S. cities are inversely related to the city's ethnic fragmentation • Cutler and Glaeser 1997 QJE Article “Are Ghettos Good or Bad”: They find that African Americans in more segregated areas have significantly worse outcomes than African Americans in less segregated areas.
3. Models (read: how can we improve them) Dependent Variable: Pollution Independent Variables: Indices of Segregation, Socioeconomic variables, etc. Pollution estimates: Total releases (volume) Toxicity-weighted releases (acute, chronic) Additional characteristics (odor, color)
Indices of Segregation (from Denton and Massey; Alesina) • Evenness (dissimilarity) • Concentration (people per physical space) • Centralization • Exposure (potential for interaction, or isolation) • Clustering (spatial proximity)
Socioeconomic Variables: • Income/Capita (by race, by age, by gender) • City Size (log of population) • Educational Attainment • Income Inequality • Poverty Rate • % Foreign Born • Home Ownership and Age of Stock • Transportation (modes, access, and time needed) • Level of Aggregation: City, County, MSA/PMSA
Spatial Improvements • Using U.S. EPA-Office of Solid Waste guidelines, Meteorological Data, and Digital Terrain Data, ISC-AERMOD software computes the risk receptor grid for multiple pollutants—“Industrial Source Complex AMS/EPA Regulatory Model” • In short, the various pollution sources are modeled along with the surface contours, air dispersion. The model takes into account the dose-response assessment for the different pollutants, creates an exposure assessment, the risk characterization from that exposure.
Theoretical Improvements • Traditional Env. Justice argument vs. Median Voter argument vs. Principle-Agent argument… • How can we incorporate political representation, interest group practices, campaign contributions, etc. into the model? • How do we model perceived risk vs. actual risk? Do we need to? • Include non-homogenous (ubiquitous) mobile source pollution?
4. Conclusions • Multiple dimensions to segregation (spatial) as opposed to traditional measures which just look at % of total population • Does our model differ from what the median voter model might predict? Perhaps the spatial distribution of races (and incomes) is a better predictor or pollution exposure and the provision of public environmental goods • With the goals of: • a)Determining if environmental racism exists • b)Figuring out how it came about in the first place • c)Attempting to predict where it may occur in the future • d)Creating ways to prevent it from happening again

![Environmental [In]justice: Environmental Health Coalition’s combat against Environmental Racism](https://cdn1.slideserve.com/3429584/slide1-dt.jpg)