Download
1 / 12
120 likes | 258 Vues
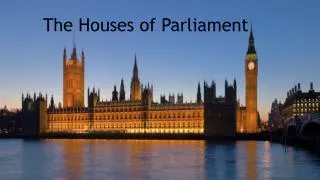
PERCEPTONS OF PARLIAMENT THE CIVIC EDUCATION FACTOR The 2010 Western Australian Findings. Dr Harry Phillips Parliamentary Fellow, Parliament of Western Australia. Preamble National Commitment to reduce the ‘Civics deficit’ National Statements and National Testing

E N D
PERCEPTONS OF PARLIAMENTTHE CIVIC EDUCATION FACTORThe 2010 Western Australian Findings. Dr Harry Phillips Parliamentary Fellow, Parliament of Western Australia
Preamble • National Commitment to reduce • the ‘Civics deficit’ • National Statements and National Testing • Western Australian Poll(s) • Civic education does count.
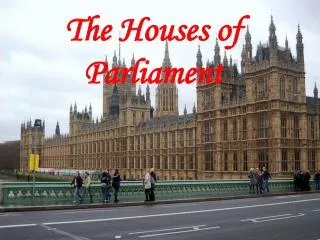
DETAILED FINDINGS Of 2010 POLL • 1 Visited Western Australian Parliament • The respondents were asked to indicate whether they had ever visited the Western Australian Parliament. • One third of electorate have visited Parliament. • Age, gender not a factor. • Less likelihood of visit by country residents and lower income groups.
2 Purpose of most recent visit • The respondents who had visited the Western Australian Parliament before (34%) were asked about the purpose of their (most recent) visit. • Over 50% for educational visit. (Higher country rates). • 14% for sight seeing. • 9% for work related. • 7% to view debate. • 4% to participate in protest.
3 The Perceived Work Standards of the WA Parliament • The respondents were asked to indicate what their perceptions about the standard of workings of the WA Parliament are, based on what they knew or had heard. The following scale was used: • Very High standard; • Quite a High standard; • Satisfactory standard; • A Quite Low standard; • A Very Low standard. • 61% - ‘net’ satisfactory and above. • No marked demographic difference • Except above 35years and low income group more likely to be ‘net’ low.
4 Personal Contact with Member(s) of the Western Australian Parliament • The respondents were asked whether they had ever met or had any direct communication with Members of the Western Australian Parliament. • 40% - some contact with MPs. • 60% - no contact with MPs.
5 Form of Contact with Western Australian Members of Parliament • The respondents who had previously experienced personal contact with one or more members of the Western Australian Parliament (117 or 39%) were asked how this contact took place from a pre-determined list of categories. • 40% Social/Street gathering with Members of Parliament • 22% Meeting Members of Parliament at location • 8% Letter/Email
6 Personal Contact with Member(s) of the Western Australian Parliament • The respondents were asked whether they had ever met or had any direct communication with Members of the Western Australian Parliament. • 29% - Submission to a Standing or Select Committee. • 18% - Guidance from Parliamentary Officers. • 13% - Sought assistance from Parliament’s Education Officer. • 5% - Provided oral evidence to a Standing /Select Committee.
7 Effect of personal contact on Opinions about the WA Parliament • Respondents who indicated they had personal contact with one or more members of the Western Australian Parliament (39%) and respondents who indicated they have had personal contact with the Western Australian Parliament itself (5%) were asked whether their communication with the Parliament of Western Australia, or with its Members has improved or reduced their opinion about the workings of the Parliament. The following scale was used: 1) Greatly Improved; 2) Slightly Improved; 3) No Effect; 4) Slightly Reduced; 5) Greatly Reduced. • 20% - Improved opinions of MPs. • 53% - No effect. • 23% - Reduced opinions of MPs.
8 Opinion on Accuracy Media Portrayal of WA Parliament • All respondents were asked to indicate how accurate they believe the picture is that the media portrays of the workings of the Western Australian Parliament. Instead of ‘income classes’, a subgroup based on ‘exposure to parliament’ is shown. The following scale was used: 1) Completely Accurate; 2) Generally Accurate; 3) Neither one nor the other; 4) Generally Inaccurate; 5) Completely Inaccurate. • 35% - Generally accurate portrayal of workings of WA Parliament by media. • 36% - Neither one nor the other. • 22% - Inaccurate portrayal of workings of WA Parliament by media.
9 Influence of Education on Opinions about the WA Parliament • The respondents were asked to indicate to what extent they expect that their ‘political and civic education’ had an influence on their perceptions of the workings of the WA Parliament. Again, instead of ‘income classes’, a subgroup based on ‘exposure to parliament’ is shown. The following scale was used: 1) Very Great; 2) Quite Great; 3) Only moderate; 4) Slight; 5) None at all. • 19% - Very great/quite great influence. • 43% - Moderate influence. • 19% - Slight. • 17% - No influence. Visiting Parliament or meeting an MP had an influence.
Key Observations A critical finding, though tentative, is that civic education, and contact with parliamentarians and the Parliament, makes a positive difference to the perceptions of Parliament and its workings. Civic education does count!