Download
1 / 18
180 likes | 366 Vues
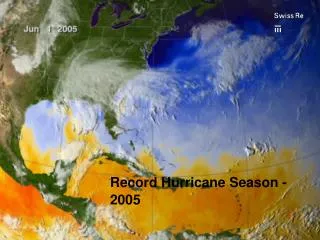
Record Hurricane Season - 2005. Record Hurricane Season - 2005. Natural Catastrophes. Challenges and Opportunities. Worldwide Nat Cat Losses. Annual insured losses from 1970 to 2005, in USD bn indexed to 2005. Strong upward trend due to: Higher insurance penetration Growing property values

E N D
Natural Catastrophes Challenges and Opportunities
Worldwide Nat Cat Losses Annual insured losses from 1970 to 2005, in USD bn indexed to 2005 Strong upward trend due to: • Higher insurance penetration • Growing property values • Coastal value concentration Source: Swiss Re sigma
Increasing Values in Exposed Areas Ocean Drive, FL, 1926. Ocean Drive, FL, 2000. Direct Premium Written Growth Rates Period 1998-2001 2002-2005 All US 26% 24% Florida 32% 47%
100 years Getting the Risk Model Right Some Cat Models are based on the last 100 years of history….
Distribution of Major Reinsurers’ S&P Rating by NPW Sources: Standard & Poor’s, Swiss Re Economic Research & Consulting
144% Average net claimin % of shareholders'equity = 43% Impact of 2005 Hurricanes on Reinsurers Importance of Size and Diversification Capital of smaller and less diversified reinsurance companies was significantly impacted by Katrina, Rita and Wilma. Market capitalisation (USD) > 15bn 5 – 15bn < 5bn USD m 5 000 75% 4 000 60% 3 000 45% Swiss Re* 2 000 30% 1 000 15% 0 0% Notes: Shareholders’ equity as of 2004; market cap as of 30.01. 2006 Source: Company data* Swiss Re claims estimate net of equalisation reserve release Current net claims estimate (bef. tax) Net claim in % of shareholders' equity
75 Quake California Quake Japan 40 35 Storm Europe 30 Typhoon Japan JER Large Loss Potentials 110 Hurricane US+Carib. Peak risks: • Earthquake or storm • In industrialisedcountries • With high insurancedensity 45 18 7 8 Daria 1990 Northridge 1994 FHCF Mireille 1991 Katrina 2005 Insurance loss potentials in USD billions: Nat cat events (indexed to 2005) Loss potentials from events with a return period of 200 years (100 years for Hurricane North Atlantic) FHCF: Florida Hurricane Catastrophe Fund state-run JER: Japan Earthquake Reinsurance Scheme schemes
US Policy Holder Surplus – Still Adequate ? US Cat Capacity provided by the P&C Insurance and Reinsurance Industry is about 25% of the US PHS. * In USD bn
ILS Market Capacity Total US Cat Bonds outstanding, by year* Issued = Issued in respective year Outstanding = Outstanding from previous years’ issuances As of June 6, 2006 Source: Swiss Re Capital Markets
Outstanding US Bond Market Debt Outstanding Level of Public & Private Bond Market Debt 1985 – 2005 Q4 ($ Billions) US Cat Capacity provided by the Capital Markets is about 0.0150% of the total amount of outstanding US Bond Market Debt ---> Growth potential ! Note: The total outstanding notional amount for credit derivatives is an additional $17 trillion for a total between the two categories of approximately $40 billion in US dollar debt and credit derivatives with substantial additional amounts of similar securities and derivatives in other currencies.
Conclusion • The severity of nat cat losses are increasing world-wide. Most of this is increase is due to a significant growth of insured values in exposed regions. • The frequency of nat cat events is subject to climate variability. It is important that risk models take this into account. • The security of reinsurance companies is lower than 10 years ago. Size and degree of diversification matter. • Capital market solutions can be structured so that the counterparty credit risk is extremely small. There is vast market potential for ILS given the size of the capital market.
We need to engage now in expanding capital market solutions to hedge the future and ensure sufficient availability of capacity. This protection of the industry’s assets, with adequate security, is of benefit to all.