Prioritization using Logic Models and MIRA
540 likes | 739 Vues
Prioritization using Logic Models and MIRA. October 17. 2007 Instituto Nacional de Ecologia Mexico City, Mexico. Part I: Logic Models. Connecting Program Activities to Environmental Outcomes. What is a Logic Model?.

Prioritization using Logic Models and MIRA
E N D
Presentation Transcript
Prioritization using Logic Models and MIRA October 17. 2007 Instituto Nacional de Ecologia Mexico City, Mexico
Part I: Logic Models Connecting Program Activities to Environmental Outcomes
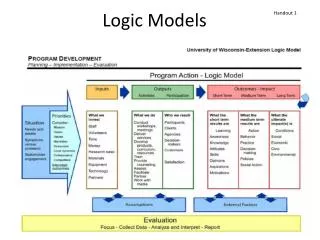
What is a Logic Model? • Tool to help understand how program activities affect environmental outcomes. • Kellogg Foundation template to start. • Foundation Home Page: http://www.wkkf.org/Default.aspx?LanguageID=0 • Logic Model Guidance Document: http://www.wkkf.org/Pubs/Tools/Evaluation/Pub3669.pdf • Modification for environmental programs.
How to build a logic model • Brainstorm activities (“individual logic model”) • Program or site activities • For each activity, ask: • Why do I do this activity? • What is(are) the intended outcome(s) of doing that activity? • What is(are) the actual outcome(s)? • What is the impact (ultimate goal) of this outcome?
How to build a logic model – cont’d. • Baseline = outcome/impacts • Need to measure the same thing at the baseline as at the end. • Stressor – Distinguish between: • Pollutant stressors • E.g., population growth, vehicle emissions • Program stressors • E.g., conflicting statute, no regulatory authority • Different stressors compel different activities/outcomes.
Logic Models good for: • Linking activities to outcomes/impacts • Helps to identify dependent activities. • If linking site activities, are different outcomes expected/desired from different sites? • Describing indicators needed to measure programs. • Defining indicators is necessary for program evaluation; Not always easy. • Learning about your programs. • Examine why you do your activities.
What Logic Models are missing: • No indicator data contained in LMs. • No way to prioritize program activities. • Use MIRA to get these…
Part II: MIRA Analyzing Information for Decision Making: Prioritizing Environmental Outcomes and Managing Risk
What’s involved in Decision analysis? Criteria/Data Science – exposure, fate/transport models, other Program implementation (logic models). Social science – environmental justice, different demographic impacts. Values Integrative, contextual approach for decision analysis.
MIRA Multi-criteria Integrated Resource Assessment MIRA Approach: Multi-criteria Transparent Data driven; relative analysis Iterative/learning-based
MIRA Data Collection Manager Geostatistical Indicators Module Fate and Transport Models Programmatic and Budget Decision Analysis Module
What is MIRA designed to do? Policy Development Assist in multi-criteria analyses for the development/implementation of policy. Understanding alternatives Improve understanding of the relationship between the data and the decision alternatives. Address stakeholder concerns Provide an analytical framework for reflecting stakeholder ideas (Inclusive)
Steps in the MIRA approach Determine the decision question. Brainstorm initial criteria. Gather data for those criteria. Construct the analytical hierarchy for the decision question. Index data (expert input). Preference criteria (stakeholder value sets). Iterate; Learn.
Hazard Ranking System (HRS) Example • Possible to use HRS score in different ways with MIRA: • Option 1: Use HRS as a decision criterion. • Option 2: Use HRS criteria and allow for flexibility for expert input and decision maker judgment. • Appropriate when you don’t have or can’t get type of data required by HRS; i.e., need to use surrogate indicators.
Option 1: HRS as Criterion • Suppose you want to evaluate both the condition of the region and program effectiveness within the region to include: • Public health impacts • Ecological impacts • Balance condition with program (in)effectiveness. • Possible to set up a decision hierarchy something like this…
Option 1: Sample MIRA Decision Hierarchy Risk Public Health Source Admin. Condition Habitat Condition Ecosystem Health Stressors ? HRS Admin. Risk Public Health Source Program Admin. Habitat Condition Ecosystem Health Stressors Stressors
Option 1: Indicator Examples Condition HRS score Economic/social costs Ozone concentration, Nutrient load Cancer risk, Exposure Program # permits/regulations approved; % impaired streams % regulations that include evaluation of alternative control technologies. Amount of time between submittal and approval of…regulation/permit/plan. “x” type of Hazardous Waste implementation plan producing change/improvement in “y” type of risk parameter by “z” amount.
Option 1: How to use HRS with other criteria • Need to consider the relative environmental significance of HRS with other criteria. • Expert discussion • What does HRS indicate? Is it a more decision significant indicator than economic cost (for example)? • If you believe no other criterion than HRS needs to be considered, you don’t need MIRA.
Option 2: Using HRS criteria as the analysis • Suppose you only want to consider hazardous waste criteria as currently used in calculating HRS… • OR: You are unable to get data required/ expected by HRS and must use surrogate indicators… • Possible to set up decision hierarchy as follows…
Observed Release Likelihood of Release Potential of Release Cancer NonCancer Chronic Toxicity/ Mobility NonCancer Acute SGW Waste Characteristics Source Haz. Waste Quantity Constituent Nearest Indiv. Waste Stream HRS Population Targets Resources SSW . . . Sensitive Ecosystems SS . . . Option 2: MIRA Hierarchy for Hazard Ranking System (HRS) SA . . .
HRS Calculation Example 1 • HRS: Likelihood of Release = greater of observed release or potential to release • To replicate in MIRA: one of these criterion will have a weight of zero in the calculation (Other = 1.0). • MIRA alternative (if not regulatory): weight these criteria in any way that adds up to 1.0 (or 100%).
HRS Calculation Example 2 • HRS Calculation Methodology • Pathway Score, S = (Likelihood of Release x Waste Characteristics x Targets)/82,500 • Max values for LR = 550, Waste = 100, Targets = 150.
Cont’d Example 2 • To replicate in MIRA: • Calculate relative weights for each of 3 factors. • E.g. LR weight = (550/82,500)/(550/82,500 + 100/82,500 + 150/82,500) = 0.691 • (LR) x 0.691 x (waste) x 0.124 x (targets) x 0.185(Fixed weights via HRS method) • Likelihood of Release is designed to be the most important criterion in the HRS calculation method (69% vs. 12% vs. 18%). • With MIRA, you can change weights if desired (and allowed by law).
HRS Calculation Example 3 • HRS = • Max pathway score (S) = 100. • HRS equation appears to weight all pathways equally BUT actually weights the pathway score that is highest most heavily (due to squaring). • In MIRA: possible to replicate weights via above equation or use other weights.
Option 2: HRS Component analysis with MIRA • What’s different about using HRS criteria in MIRA vs. just calculating HRS? • Allows for transparency in seeing relative importance (weights) of all the criteria composing the HRS. • Possible to use additional criteria (economic/ social) if desired. • Possible to use surrogate criteria if data required by HRS is not available. • If law requires HRS method, using MIRA is not an option. • BUT could use MIRA to inform other decisions.
MIRA Approach • Step 1: Determine the decision question. • Step 2: Brainstorm initial criteria. • Step 3: Construct the analytical hierarchy for the decision question. • Step 4: Address missing data. • Step 5: Decide on decision’s unit of measure. • Step 6: Index data (expert input). • Step 7: Preference criteria (stakeholder value sets). • Step 8: Iterate; Learn.
Step 1: Formulating the Decision Question • Decision makers/stakeholders formulate the question that they want to answer and the criteria they think they need to answer it. • What are the problem set elements that you are analyzing/ranking? • e.g. watersheds?, counties?, emission control strategies?
Step 2: Brainstorm Initial Criteria • Are data available for these criteria? • Are data available on the scale that you want? • States?, Counties?, watersheds?, stream segments? Other? • If not: • Is another scale possible? • Can surrogate data be used? • Should this be identified for future data collection?
Step 3a: Construct the Decision Hierarchy Provides decision context. Forces stakeholders to assess whether they agree on the decision question that they want to answer.
Step 3b: Methodological thinking for constructing the hierarchy • Should each criterion currently organized at each level of the hierarchy be directly comparable? • E.g., Would you compare Arsenic in ground water with Ozone air quality? OR would a better comparison be Water (with groundwater under it) with Air (with Ozone under it)?
Step 4: Determine which criteria have no/missing data • Possible alternatives to no data • Health impact data – pollutant concentration – source emissions – number of sources? • Data collected by volunteers/other organizations. • Using similar data (from another program, etc.). • Possible alternatives to missing data • Statistical analyses – e.g., multivariate analyses • Data collected by volunteers/other organizations. • Modeling.
Note about previously constructed indicators What do these indicators indicate? Is this meaningful in your current analysis? Can better indicators for your analysis be constructed with currently available data?
Step 5: Deciding on the Decision’s unit of measure • Depends on the decision question • What is the condition of the watersheds in the region? • Degree of degradation • Which watersheds should be restored? • Degree of restorability
Continued… • OR combine questions: • Based on the condition of the watersheds and the restorability of the watersheds, which should we restore? • Motivation to restore
Step 6a: Indexing the data • Convert all criteria metrics to the decision unit. • Indexing = Relative comparison among the range of metric values on a decision scale; = unit converter (converts units of each criterion metric to the decision unit). • Expert Input here • What is the decision significance of the indicator values? • Same indicator can have different signficance for another decision question.
Step 6b: Approach to Indexing the Data • Use a decision scale of 1 to 8. • Assumption: Each criterion is of equal value or importance. • BUT Metrics are not looked at independently. • Task in indexing is to define what value of each criterion elicits the same response. Set these values to the same index. • E.g., $1 million is a lot of money and 95 ppb of ozone is a high ozone level (on par with $1 mil) (they both elicit a “that’s a lot” response), so set them both to the same index.
Step 6c: Thinking about Indexing Range of metric/indicator values? Type of distribution? Double check: Compare values for criteria pairs – same significance? Initialize; Change later if needed.
Step 7: Preferencing • All criteria are not equally important to the decision makers/stakeholders. • Preferencing = Relative comparison of the importance of one criterion to other criteria.
Step 7b: Thinking about Preferencing • Initialize by setting all criteria preferences to equal weights (i.e., all criteria equally important to the decision question within each level of the hierarchy). = Equal preference value set. • Iterate • Test different value sets • Examine indexing • Examine data – including quality assurance of data.
Step 8: Iteration Test different value sets Examine indexing Examine data Examine data uncertainty Re-run analysis with different “what if” scenarios.
S_Dep Indexed Sulfur Deposition Raw Data Phosphorus Loading Raw Data P_Load Indexed
P_Load and S_Dep Combined (equally important) 80% P_Load, 20% S_Dep • Science significance stays the same. • Decision maker judgments alter priorities but decision process is transparent. • S_Dep hot spot (NW PA) determined to be more scientifically significant than P_Load hot spot (Delmarva Peninsula).
Role of experts in MIRA Experts in all fields of study to discuss issues: Indicator Types; construction of appropriate indicators? Data* for indicators (existing, new) Missing data issues Scale of indicators/data Combining public health and ecological information Indexing data (determine relative significance of data)
Role of decision makers in MIRA • Learn the impact of different value sets (i.e., relative preference weights among decision criteria) on the decision options. • Science remains constant. • Examine/compare the results of different value sets. • Make a decision after being informed about the impacts of all the options examined. • Build decision confidence. • Provide documentation and rationale for decision.
MIRA different from other decision support approaches… • Hierarchy:represents decision question • Indexing:Expert input = relative decision significance of the indicators • Preferencing:Decision maker/stakeholder judgments = relative importance of the decision criteria for this decision. • Relative contextual analysis. • Illustrates what/where the tradeoffs are – as constrained by the data. – Learning.
MIRA References • http://www.epa.gov/reg3artd/airquality/mira_descr.htm • Cimorelli, A. and Stahl, C. (2005), BSTS 25(3): 1, “Tackling the Dilemma of the Science-Policy Interface in Environmental Policy Analysis.” • Stahl, C.H. (2003), “Multi-criteria Integrated Resource Assessment (MIRA): A New Decision Analytic Approach to Inform Environmental Policy Analysis.” For the Degree of Doctor of Philosophy, University of Delaware. • Stahl, C. H. and Cimorelli, A. J. (2005), Risk Analysis 25(5): 1109, “How Much Uncertainty is Too Much and How Do We Know? A Case Example of Ozone Monitor Network Options.”
Part III: Logic Model Outputs as MIRA Inputs Program prioritization
What do we get with LMs and MIRA? Integration of Data and Program Activities. Are we doing the right activities? – based on where the “worst” conditions are. Which activities have the greatest effect on the outcomes/impacts we seek? – based on which outcomes/impacts we value most highly AND the condition data. Which activities are dependent on which other activities? Capability to prioritize program outcomes using data. Transparency Learning
Example Logic Models • Air Quality Monitoring Logic Model • Ozone Program Logic Model • Trace monitoring activity (certification of ozone air quality data) through Monitoring Logic Model outputs/outcome/impacts • See Red text in following figure. • Follow black boxes within Monitoring logic model in following figure.