Download
1 / 63
640 likes | 924 Vues
Nature and Perspectives. AP Human Geography Unit 1. What is geography?. Is geography scientific? “ The why of where” AP Human vs. World Geography Course: Human vs. Physical Topical vs. Regional Approach Descriptive vs. Systematic. Oral Quiz: Pages 14-17.

E N D
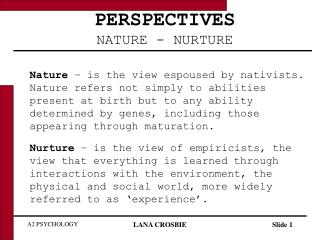
Nature and Perspectives AP Human Geography Unit 1
What is geography? • Is geography scientific? • “The why of where” • AP Human vs. World Geography Course: • Human vs. Physical • Topical vs. Regional Approach • Descriptive vs. Systematic
Oral Quiz: Pages 14-17 #1: Define site and provide two examples. #2: Define situation and provide two examples.
Do maps lie? Mercator Fuller’s
Does your map look anything like this? • This is the one of the oldest known maps (Ga-Sur 2500BCE), drawn on a clay tablet in Ancient Babylon. Line drawn image of the map
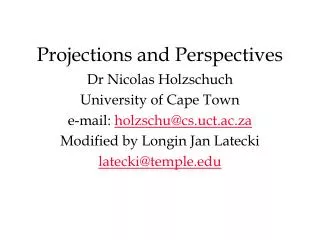
The Problem with Projection • Round object on a flat surface • Distorted shape • Relative size • Distance • Direction …or…
Problem of Projection Mercator Fuller’s Robinson
Problem of Projection Equal Area Peters
Problem of Projection Conic—p.12-13 (atlas) • Cylindrical—p.10 (atlas) Planar (Azimuthal) --p.46 (atlas)
Map Characteristics • Projection • Scale—relationship between distance on the map and distance on the ground • large vs. small—which is bigger 1/10 or 1/100?, large scale=large fraction • Scale has multiple meanings for geographers • Symbols • Thematic Maps—show the distribution, flow, or connection of one or more characteristics • Data Manipulation • Grid System
Scale Downtown Seattle, Washington(1:10,000 scale) Washington State (1:10 million scale) Seattle Region(1:100,000 scale) Western Washington(1:1 million scale)
Map Characteristics • Projection • Scale—relationship between distance on the map and distance on the ground • large vs. small—which is bigger 1/10 or 1/100?, large scale=large fraction • Scale has multiple meanings for geographers • Symbols • Thematic Maps—show the distribution, flow, or connection of one or more characteristics • Data Manipulation • Grid System
2008 Electoral Map (Cartogram—population) Map Symbols Cell Towers (Dot Map) Individuals living in Poverty, 2000 (Choropleth) Multiple Symbol Map
Map Symbols Isoline Map Relief Map Pie chart map in millions, (Proportional Symbols)
Map Characteristics • Projection • Scale—relationship between distance on the map and distance on the ground • large vs. small—which is bigger 1/10 or 1/100?, large scale=large fraction • Scale has multiple meanings for geographers • Symbols • Thematic Maps—show the distribution, flow, or connection of one or more characteristics • Data Manipulation • Grid System
Misleading Scale This map shows the total number of African-Americans per state. Examine Georgia.
Misleading Scale In the previous slide, Georgia had one of the highest number of African-Americans, but a closer look tells a different picture. The dark red is the Atlanta metropolitan area.
Misleading Statistics A similar comparison can be made with Hispanics living in the US. This map shows the total percentage of Hispanics in each county.
Misleading Statistics This map displays the total number of Hispanics in each US county.
Misleading Statistics These three Southern California counties (Los Angeles, Orange, and San Diego) have a total Hispanic population of 5,045,726 which is greater than the total Hispanic population of Texas at 4,339,905. New Mexico has the greatest percentage of Hispanics (33%), it’s total Hispanic population is 579,224.
Map Characteristics • Projection • Scale—relationship between distance on the map and distance on the ground • large vs. small—which is bigger 1/10 or 1/100?, large scale=large fraction • Scale has multiple meanings for geographers • Symbols • Thematic Maps—show the distribution, flow, or connection of one or more characteristics • Data Manipulation • Grid System
Spatial Data and Thematic Maps Mapping Natural Disasters
Choropleth Map EQUAL FREQUENCY
Chropleth Map EQUAL INTERVAL
Choropleth Map NATURAL BREAKS (JENKS’ FORMULA)
Map Characteristics • Projection • Scale—relationship between distance on the map and distance on the ground • large vs. small—which is bigger 1/10 or 1/100?, large scale=large fraction • Scale has multiple meanings for geographers • Symbols • Thematic Maps—show the distribution, flow, or connection of one or more characteristics • Data Manipulation • Grid System
Fundamentals of geography • Scale: relationship between the portion of Earth being studied and Earth as a whole, similarities at local, regional and global levels (global vs. local) • Place: location, or position, unique for its particular characteristics • Region: unique and distinctive areas, area distinguished by a distinctive combination of cultural and physical features • Space: physical gap or interval between two objects, often concerned with density and pattern • Connections: relationships among places
Place • Toponym, Site, Situation (relative location), Mathematical Location (exact location) • Mental Maps: using the concept of place… • Find a partner…on a piece of paper, draw a mental map of your neighborhood, the Marietta/Cobb County area, and Atlanta. Include a home address in your map. Show as much detail as you can, and remember to make the map accurate in terms of what is important to you, such as the places you eat, work, walk, recreate, friends’ houses, landmarks,etc. Finally, make sure you include your own made-up symbols and associated legend/key…you don’t need to use a map, or electronic device for this activity.
View of Kennesaw Mt., from Sweat Mt. Place • As you look over your map consider the following questions… • What do you personally consider to be the most important features on your map? Why? How do these features/places shape your “sense of place?” • Why are certain businesses or houses located where they are? • How have people influenced the physical and/or cultural environment in a particular area noted on your map? • How long have you lived here? How has this affected your mental map? “Egocentric vs. Geocentric perspective ” • How do you get around? Do you drive, walk, or bike? How has this affected your mental map? “Cognitive distance” • What are the fringes of your map and how are those places represented?
Mathematical Location • Why latitude and longitude? • Latitude/Parallel • Equator • Longitude/Meridian • Prime Meridian • International Dateline
Mathematical Location: Time Zones The world’s 24 standard time zones each represent about 15° of longitude. They are often depicted using the Mercator projection.
Math. Location: Township & Range System in the US Principal meridians & east-west baselines of the township system. Townships in northwest Mississippi & topographic map of the area.
Evolution of mapping • Remote Sensing • acquisition of data about Earth’s surface from a satellite orbiting Earth • Geographic Information Systems (GIS) • acquiring, analyzing, processing, and displaying spatial data—such as location andvarious characteristics (ie. elevation, vegetation, population,slope, climate, etc.)—often in layers • Global Position System (GPS) • accurately determines the precise position of something on Earth
Map Interpretation Example: • HIV/AIDS , 2002. Figure 2-26, pg. 75 Rubenstein • Equal Area Projection, choropleth, • Demonstrates capacity of AIDS to be a global reducer of population and identify key global regions hardest hit by the epidemic. • Sahara Desert seems to serve as an obstacle to the diffusion of AIDS from the southern part which is primarily devastated by the disease. • Other global parts that exhibit at least an above average problem with the disease are usually located in the tropics, with the exception of the Ukraine in eastern Europe. • It might be interesting to see differences within countries. I would also like some indication just how high the infection rate is in countries over 15%.
United States Mental Map Divide the United States into regions. Your regions can be functional, formal, or vernacular. Every portion of the country should be located in at least one region. Be sure to identify the key characteristic as you name each region.
Region • “Areas of unique characteristics” • Culture • What people care about • What people take care of • Cultural Landscape
Region • Formal (uniform) • Functional (nodal) The state of Iowa is an example of a formal region; the areas of influence of various television stations are examples of functional regions.
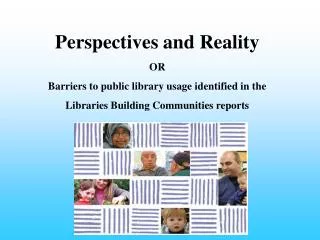
Region • Vernacular (perceptual) • What is “the West?” Name 3 regions in which we live. A number of features are often used to define the South as a vernacular region, each of which identifies somewhat different boundaries.
Most Famous Brand From Each State In The US